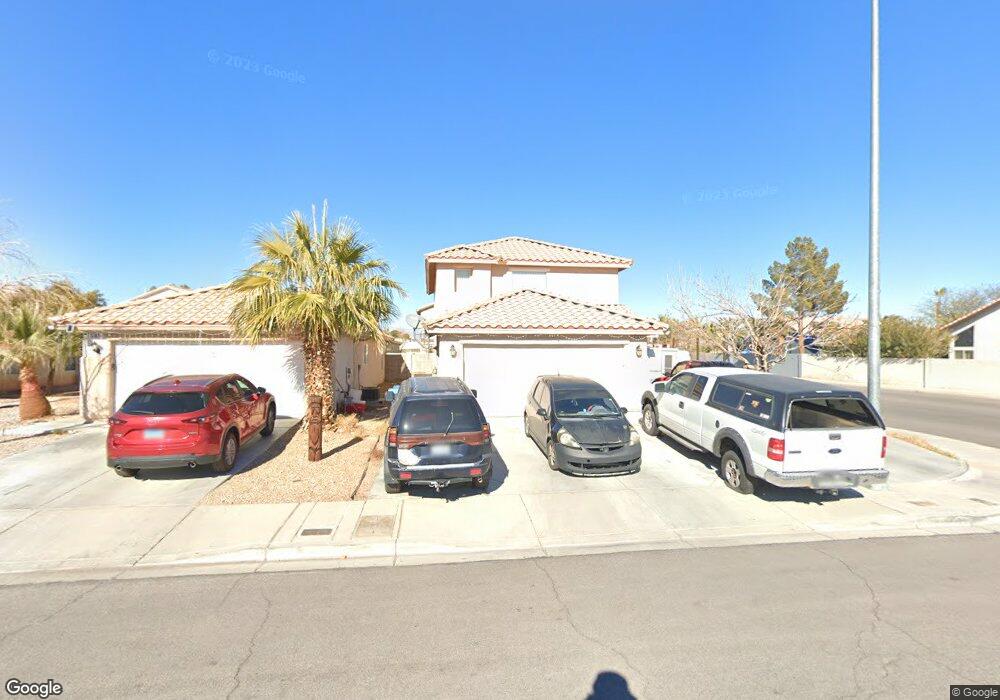
5194 Baldy Ln Las Vegas, NV 89110
Estimated Value: $383,000 - $460,000
3
Beds
3
Baths
1,822
Sq Ft
$231/Sq Ft
Est. Value
About This Home
This home is located at 5194 Baldy Ln, Las Vegas, NV 89110 and is currently estimated at $420,251, approximately $230 per square foot. 5194 Baldy Ln is a home located in Clark County with nearby schools including Stanford Elementary School, Duane D. Keller Middle School, and Eldorado High School.
Ownership History
Date
Name
Owned For
Owner Type
Purchase Details
Closed on
Dec 28, 2007
Sold by
Paglinawan Pedro E
Bought by
Paglinawan Ian B and Paglinawan Mary Grace B
Current Estimated Value
Purchase Details
Closed on
Nov 21, 2001
Sold by
Paglinawan Maria Theresa
Bought by
Paglinawan Pedro E
Home Financials for this Owner
Home Financials are based on the most recent Mortgage that was taken out on this home.
Original Mortgage
$148,494
Outstanding Balance
$57,654
Interest Rate
6.63%
Mortgage Type
FHA
Estimated Equity
$362,597
Purchase Details
Closed on
Nov 17, 2001
Sold by
Kb Home Nevada Inc
Bought by
Paglinawan Pedro E and Paglinawan Ian B
Home Financials for this Owner
Home Financials are based on the most recent Mortgage that was taken out on this home.
Original Mortgage
$148,494
Outstanding Balance
$57,654
Interest Rate
6.63%
Mortgage Type
FHA
Estimated Equity
$362,597
Create a Home Valuation Report for This Property
The Home Valuation Report is an in-depth analysis detailing your home's value as well as a comparison with similar homes in the area
Home Values in the Area
Average Home Value in this Area
Purchase History
| Date | Buyer | Sale Price | Title Company |
|---|---|---|---|
| Paglinawan Ian B | -- | None Available | |
| Paglinawan Pedro E | -- | None Available | |
| Paglinawan Pedro E | -- | First American Title Co | |
| Paglinawan Pedro E | $151,248 | First American Title Co |
Source: Public Records
Mortgage History
| Date | Status | Borrower | Loan Amount |
|---|---|---|---|
| Open | Paglinawan Pedro E | $148,494 |
Source: Public Records
Tax History Compared to Growth
Tax History
| Year | Tax Paid | Tax Assessment Tax Assessment Total Assessment is a certain percentage of the fair market value that is determined by local assessors to be the total taxable value of land and additions on the property. | Land | Improvement |
|---|---|---|---|---|
| 2025 | $1,429 | $92,419 | $26,600 | $65,819 |
| 2024 | $1,324 | $92,419 | $26,600 | $65,819 |
| 2023 | $882 | $89,491 | $27,300 | $62,191 |
| 2022 | $1,226 | $78,808 | $22,050 | $56,758 |
| 2021 | $1,136 | $73,602 | $19,600 | $54,002 |
| 2020 | $1,052 | $73,190 | $19,600 | $53,590 |
| 2019 | $986 | $66,667 | $14,000 | $52,667 |
| 2018 | $940 | $62,496 | $12,250 | $50,246 |
| 2017 | $1,817 | $61,970 | $11,200 | $50,770 |
| 2016 | $882 | $52,626 | $7,350 | $45,276 |
| 2015 | $879 | $35,339 | $5,250 | $30,089 |
| 2014 | $853 | $28,217 | $4,200 | $24,017 |
Source: Public Records
Map
Nearby Homes
- 1139 Betty Ln
- 1385 Ringe Ln
- 5383 E Washington Ave
- 4932 E Washington Ave
- 4828 Lakestream Ave
- 4928 E Monroe Ave
- 4809 Sunny Brook Ave
- 1112 Sandy Cove St
- 4541 E Owens Ave
- 5260 Carriellen Ln
- 0 Washington Unit 2360795
- 5717 Christchurch Ave
- 730 N Christy Ln
- 1667 Rockwell Ln
- 1009 Greenbank St
- 1345 Stokes St
- 5754 Cinnabar Ave
- 5275 Hagemann Ln
- 5772 Cinnabar Ave
- 817 Bladensburg St
- 5188 Baldy Ln
- 5195 E Washington Ave
- 5187 E Washington Ave
- 5210 Baldy Ln
- 5176 Baldy Ln
- 5181 E Washington Ave
- 5193 Baldy Ln
- 5187 Baldy Ln
- 5211 E Washington Ave
- 5170 Baldy Ln
- 5181 Baldy Ln
- 5175 E Washington Ave
- 1145 Red Iron Way
- 5220 Baldy Ln
- 5175 Baldy Ln
- 5164 Baldy Ln
- 5167 E Washington Ave
- 5169 Baldy Ln
- 1135 Red Iron Way
- 5223 E Washington Ave