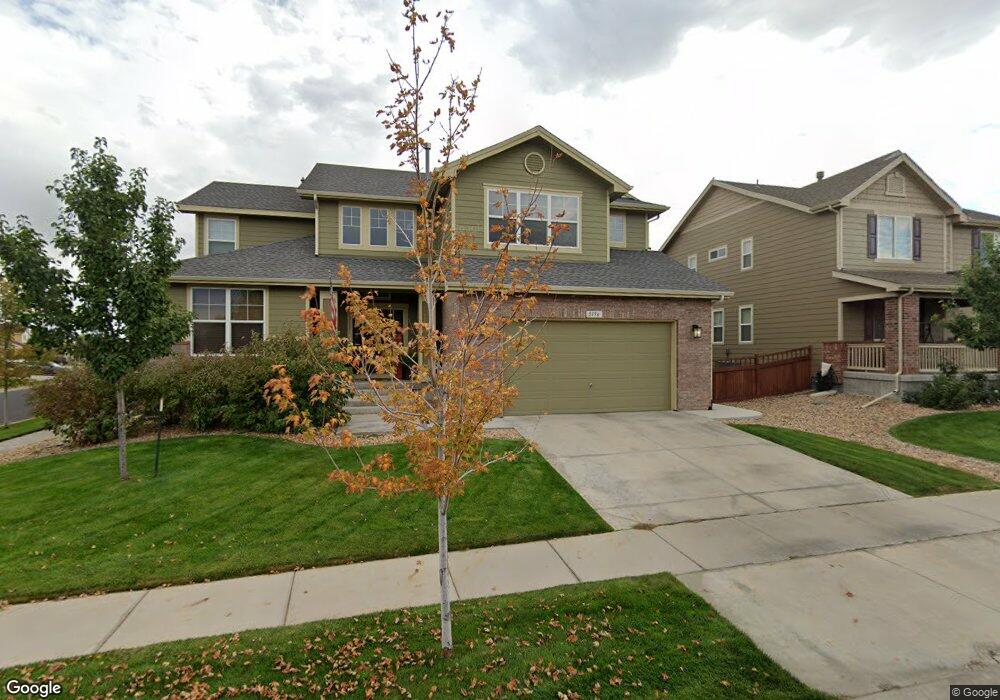
5194 Delphinium Cir Brighton, CO 80601
Estimated Value: $591,000 - $674,000
3
Beds
3
Baths
4,576
Sq Ft
$136/Sq Ft
Est. Value
About This Home
This home is located at 5194 Delphinium Cir, Brighton, CO 80601 and is currently estimated at $622,922, approximately $136 per square foot. 5194 Delphinium Cir is a home located in Adams County with nearby schools including Overland Trail Middle School, Brighton High School, and Bromley East Charter School.
Ownership History
Date
Name
Owned For
Owner Type
Purchase Details
Closed on
May 15, 2019
Sold by
Nordman Matthew C and Nordman Amanda R
Bought by
Miller Robyn R and Miller Ryan M
Current Estimated Value
Home Financials for this Owner
Home Financials are based on the most recent Mortgage that was taken out on this home.
Original Mortgage
$437,525
Outstanding Balance
$387,867
Interest Rate
4.62%
Mortgage Type
FHA
Estimated Equity
$235,055
Purchase Details
Closed on
Sep 29, 2015
Sold by
Melody Homes Inc
Bought by
Nordman Matthew C and Nordman Amanda R
Home Financials for this Owner
Home Financials are based on the most recent Mortgage that was taken out on this home.
Original Mortgage
$387,346
Interest Rate
3.97%
Mortgage Type
New Conventional
Create a Home Valuation Report for This Property
The Home Valuation Report is an in-depth analysis detailing your home's value as well as a comparison with similar homes in the area
Home Values in the Area
Average Home Value in this Area
Purchase History
| Date | Buyer | Sale Price | Title Company |
|---|---|---|---|
| Miller Robyn R | $460,000 | Wfg National Title | |
| Nordman Matthew C | $407,733 | Heritage Title Co |
Source: Public Records
Mortgage History
| Date | Status | Borrower | Loan Amount |
|---|---|---|---|
| Open | Miller Robyn R | $437,525 | |
| Previous Owner | Nordman Matthew C | $387,346 |
Source: Public Records
Tax History Compared to Growth
Tax History
| Year | Tax Paid | Tax Assessment Tax Assessment Total Assessment is a certain percentage of the fair market value that is determined by local assessors to be the total taxable value of land and additions on the property. | Land | Improvement |
|---|---|---|---|---|
| 2024 | $6,695 | $38,500 | $7,190 | $31,310 |
| 2023 | $7,615 | $44,580 | $7,780 | $36,800 |
| 2022 | $5,860 | $33,870 | $7,370 | $26,500 |
| 2021 | $5,863 | $33,870 | $7,370 | $26,500 |
| 2020 | $5,446 | $32,670 | $7,580 | $25,090 |
| 2019 | $5,454 | $32,670 | $7,580 | $25,090 |
| 2018 | $5,237 | $32,190 | $6,480 | $25,710 |
| 2017 | $5,242 | $32,190 | $6,480 | $25,710 |
| 2016 | $4,129 | $26,970 | $4,300 | $22,670 |
| 2015 | $576 | $3,780 | $3,780 | $0 |
| 2014 | -- | $450 | $450 | $0 |
Source: Public Records
Map
Nearby Homes
- 5161 Chicory Cir
- 5131 Delphinium Cir
- 5277 Royal Pine St
- 5242 Longs Peak St
- 4948 Spinning Wheel Dr
- 5301 Cherry Blossom Dr
- 4864 Longs Peak St
- 376 Chardon Ave
- 5540 Juniper Dr
- 238 Chardon Ave
- 732 Lilac Ct
- 226 Chardon Ave
- 214 Chardon Ave
- 4776 Kipp Place
- 607 Azalea St
- 4766 Hatcher Dr
- 4754 Hatcher Dr
- 282 Tall Spruce Cir
- 432 Hedgerow Way
- 329 Apache Plume St
- 5192 Delphinium Cir
- 5199 Thistle Dr
- 5190 Delphinium Cir
- 5238 Royal Pine St
- 5195 Thistle Dr
- 5249 Royal Pine St
- 5255 Royal Pine St
- 5247 Royal Pine St
- 5191 Delphinium Cir
- 5182 Delphinium Cir
- 5239 Royal Pine St
- 5189 Thistle Dr
- 5257 Royal Pine St
- 5236 Royal Pine St
- 5183 Delphinium Cir
- 5179 Thistle Dr
- 5237 Royal Pine St
- 5180 Delphinium Cir
- 5259 Royal Pine St
- 5228 Royal Pine St