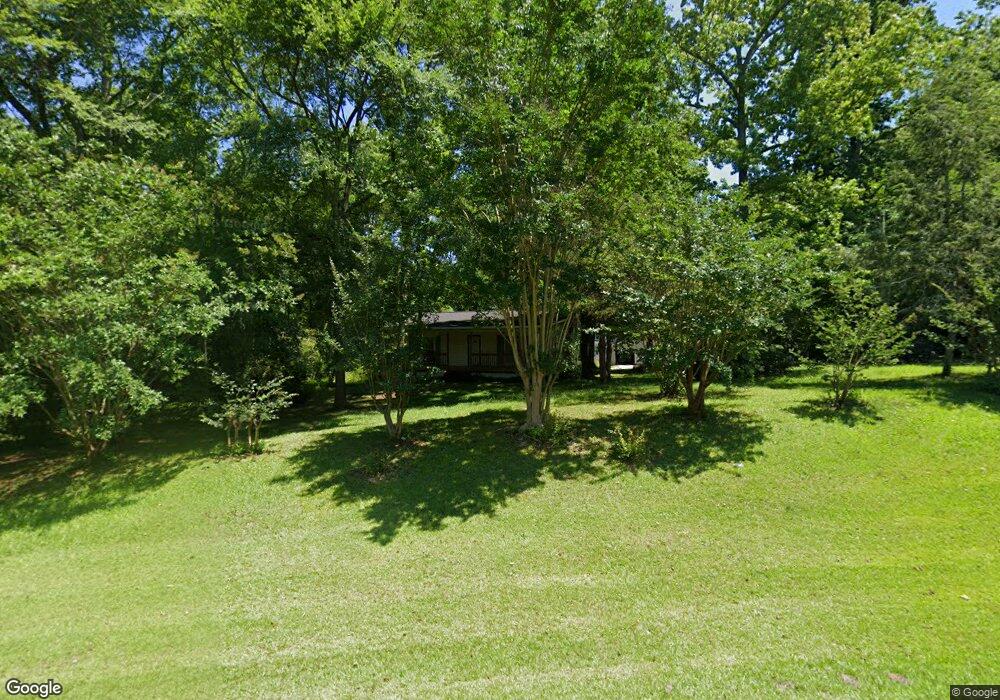
5195 New Kings Bridge Rd Nicholson, GA 30565
Estimated Value: $224,819 - $308,000
--
Bed
2
Baths
1,102
Sq Ft
$235/Sq Ft
Est. Value
About This Home
This home is located at 5195 New Kings Bridge Rd, Nicholson, GA 30565 and is currently estimated at $258,455, approximately $234 per square foot. 5195 New Kings Bridge Rd is a home located in Jackson County with nearby schools including South Jackson Elementary School, East Jackson Middle School, and East Jackson Comprehensive High School.
Ownership History
Date
Name
Owned For
Owner Type
Purchase Details
Closed on
Jul 7, 2008
Sold by
Hawkins Tracy L
Bought by
Hawkins Tracy L and Hawkins Cristie K
Current Estimated Value
Home Financials for this Owner
Home Financials are based on the most recent Mortgage that was taken out on this home.
Original Mortgage
$76,000
Outstanding Balance
$49,055
Interest Rate
6.08%
Mortgage Type
New Conventional
Estimated Equity
$209,400
Purchase Details
Closed on
Jun 30, 2008
Sold by
Wallace Rodney
Bought by
Hawkins Tracy L
Home Financials for this Owner
Home Financials are based on the most recent Mortgage that was taken out on this home.
Original Mortgage
$76,000
Outstanding Balance
$49,055
Interest Rate
6.08%
Mortgage Type
New Conventional
Estimated Equity
$209,400
Purchase Details
Closed on
Nov 10, 2004
Sold by
Morales Carlos and Ricardo Fornos
Bought by
Wallace Rodney and Wallace Sharon
Purchase Details
Closed on
Nov 9, 2004
Sold by
The Peoples Bank
Bought by
Wallace Rodney and Wallace Sharon
Create a Home Valuation Report for This Property
The Home Valuation Report is an in-depth analysis detailing your home's value as well as a comparison with similar homes in the area
Home Values in the Area
Average Home Value in this Area
Purchase History
| Date | Buyer | Sale Price | Title Company |
|---|---|---|---|
| Hawkins Tracy L | -- | -- | |
| Hawkins Tracy L | $72,000 | -- | |
| Wallace Rodney | -- | -- | |
| Wallace Rodney | -- | -- |
Source: Public Records
Mortgage History
| Date | Status | Borrower | Loan Amount |
|---|---|---|---|
| Open | Hawkins Tracy L | $76,000 | |
| Closed | Hawkins Tracy L | $76,000 |
Source: Public Records
Tax History Compared to Growth
Tax History
| Year | Tax Paid | Tax Assessment Tax Assessment Total Assessment is a certain percentage of the fair market value that is determined by local assessors to be the total taxable value of land and additions on the property. | Land | Improvement |
|---|---|---|---|---|
| 2024 | $2,587 | $102,280 | $22,440 | $79,840 |
| 2023 | $2,615 | $73,080 | $22,440 | $50,640 |
| 2022 | $1,391 | $47,840 | $7,600 | $40,240 |
| 2021 | $1,377 | $47,840 | $7,600 | $40,240 |
| 2020 | $1,375 | $43,600 | $10,960 | $32,640 |
| 2019 | $1,396 | $43,600 | $10,960 | $32,640 |
| 2018 | $1,367 | $42,080 | $10,960 | $31,120 |
| 2017 | $1,231 | $37,599 | $9,325 | $28,274 |
| 2016 | $1,238 | $37,599 | $9,325 | $28,274 |
| 2015 | $1,244 | $37,599 | $9,325 | $28,274 |
| 2014 | $1,022 | $31,151 | $9,325 | $21,826 |
| 2013 | -- | $31,150 | $9,324 | $21,826 |
Source: Public Records
Map
Nearby Homes
- 97 Abby Ln
- 140 Levi Trail
- 130 Levi Trail
- 4419 New Kings Bridge Rd
- 1718 Ed Bennett Rd
- 0 US Hwy 441 S Unit 20890220
- 422 Blessings Ln
- 223 Sawdust Trail
- 9898 Jefferson River Rd
- 9990 Jefferson River Rd
- 9992 Jefferson River Rd
- 10 Red Rose Rd
- 0 Watkins Trail Unit TRACT 22
- 0 Sanford Oak Ct Unit TRACT 11
- 0 Sanford Oak Ct Unit TRACT 12
- 0 Sanford Oak Ct Unit 7683743
- 322 Cedar Tree Ln
- 7 Red Rose Rd
- 9 Red Rose Rd
- 201 Westminster Dr
- 5199 New Kings Bridge Rd
- 24 Shadow Ln
- 0 Chandler Bridge Rd Unit 10 8241817
- 0 Chandler Bridge Rd Unit 8901951
- 31 Shadow Ln
- 49 Shadow Ln
- 30 Chandler Bridge Rd
- 55 Shadow Ln
- 128 Little Valley Church Rd
- 51 Chandler Bridge Rd
- 51 Chandler Bridge Rd
- 5238 New Kings Bridge Rd
- 5090 New Kings Bridge Rd
- 187 Little Valley Church Rd
- 78 Chandler Bridge Rd
- 9028 Old Highway 441
- 9039 Old Highway 441
- 9246 Commerce Rd
- 9246 Commerce Rd
- 9010 Highway 441