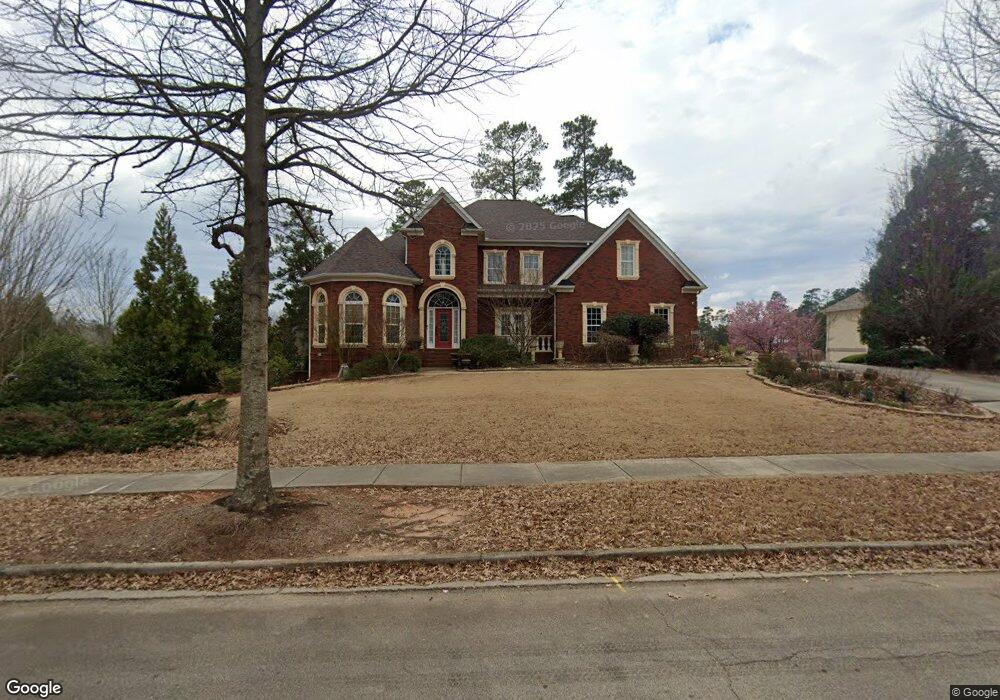
5197 Heron Bay Blvd Locust Grove, GA 30248
Estimated Value: $583,079 - $723,000
5
Beds
5
Baths
3,281
Sq Ft
$198/Sq Ft
Est. Value
About This Home
This home is located at 5197 Heron Bay Blvd, Locust Grove, GA 30248 and is currently estimated at $648,270, approximately $197 per square foot. 5197 Heron Bay Blvd is a home located in Henry County with nearby schools including Bethlehem Elementary School, Luella Middle School, and Luella High School.
Ownership History
Date
Name
Owned For
Owner Type
Purchase Details
Closed on
Dec 28, 2011
Sold by
Deutsche Bank National Tru
Bought by
Crayton Iris J
Current Estimated Value
Purchase Details
Closed on
Sep 6, 2011
Sold by
Bolden Charles H
Bought by
Deutsche Bank National Trust C and C/O American Home Mtg Servicin
Purchase Details
Closed on
Nov 10, 2005
Sold by
Kevin Fort Hms Inc
Bought by
Bolden Charles H
Home Financials for this Owner
Home Financials are based on the most recent Mortgage that was taken out on this home.
Original Mortgage
$395,500
Interest Rate
6%
Mortgage Type
New Conventional
Purchase Details
Closed on
Aug 5, 2004
Sold by
Cole Tract Assoc
Bought by
Kevin Fort Homes Inc
Home Financials for this Owner
Home Financials are based on the most recent Mortgage that was taken out on this home.
Original Mortgage
$375,000
Interest Rate
6.19%
Create a Home Valuation Report for This Property
The Home Valuation Report is an in-depth analysis detailing your home's value as well as a comparison with similar homes in the area
Home Values in the Area
Average Home Value in this Area
Purchase History
| Date | Buyer | Sale Price | Title Company |
|---|---|---|---|
| Crayton Iris J | $250,000 | -- | |
| Deutsche Bank National Trust C | $279,900 | -- | |
| Bolden Charles H | $565,000 | -- | |
| Kevin Fort Homes Inc | $96,000 | -- |
Source: Public Records
Mortgage History
| Date | Status | Borrower | Loan Amount |
|---|---|---|---|
| Previous Owner | Bolden Charles H | $395,500 | |
| Previous Owner | Kevin Fort Homes Inc | $375,000 |
Source: Public Records
Tax History Compared to Growth
Tax History
| Year | Tax Paid | Tax Assessment Tax Assessment Total Assessment is a certain percentage of the fair market value that is determined by local assessors to be the total taxable value of land and additions on the property. | Land | Improvement |
|---|---|---|---|---|
| 2025 | $6,130 | $262,600 | $38,400 | $224,200 |
| 2024 | $6,130 | $255,960 | $38,400 | $217,560 |
| 2023 | $6,666 | $245,880 | $35,200 | $210,680 |
| 2022 | $6,111 | $201,040 | $32,000 | $169,040 |
| 2021 | $5,283 | $166,000 | $27,000 | $139,000 |
| 2020 | $5,842 | $173,040 | $24,000 | $149,040 |
| 2019 | $5,478 | $157,640 | $24,000 | $133,640 |
| 2018 | $0 | $152,960 | $24,000 | $128,960 |
| 2016 | $5,153 | $143,880 | $23,400 | $120,480 |
| 2015 | $5,328 | $145,400 | $27,760 | $117,640 |
| 2014 | $5,146 | $135,400 | $32,000 | $103,400 |
Source: Public Records
Map
Nearby Homes
- 5200 Heron Bay Blvd
- 1603 Falcon Ct
- 6025 Golf View Crossing
- 1528 Windward Dr
- 1141 Pebble Creek Ln
- 6409 Caledon Ct
- 1143 Pebble Creek Ln
- 1731 Panorama Dr
- 6508 Terraglen Way
- 250 High Court Way
- 5297 Heron Bay Blvd
- 5353 Heron Bay Blvd
- 5357 Heron Bay Blvd
- 5361 Heron Bay Blvd
- 5365 Heron Bay Blvd
- 6856 Louis Dr
- 6856 Louis Dr Unit LOT 1
- 6801 Louis Dr
- 156 Cottage Club Dr
- 150 Cottage Club Dr
- 5201 Heron Bay Blvd
- 5205 Heron Bay Blvd
- 5193 Heron Bay Blvd
- 5193 Heron Bay Blvd Unit 33
- 5193 Heron Bay Blvd Unit 2
- 5196 Heron Bay Blvd
- 5196 Heron Bay Blvd Unit 17
- 5192 Heron Bay Blvd
- 5188 Heron Bay Blvd
- 5204 Heron Bay Blvd
- 5209 Heron Bay Blvd
- 1301 Linkview Crossing
- 5184 Heron Bay Blvd
- 5184 Heron Bay Blvd Unit 14
- 5208 Heron Bay Blvd Unit LOT 20
- 5208 Heron Bay Blvd
- 5213 Heron Bay Blvd
- 1303 Linkview Crossing
- 1501 Windward Dr
- 5212 Heron Bay Blvd