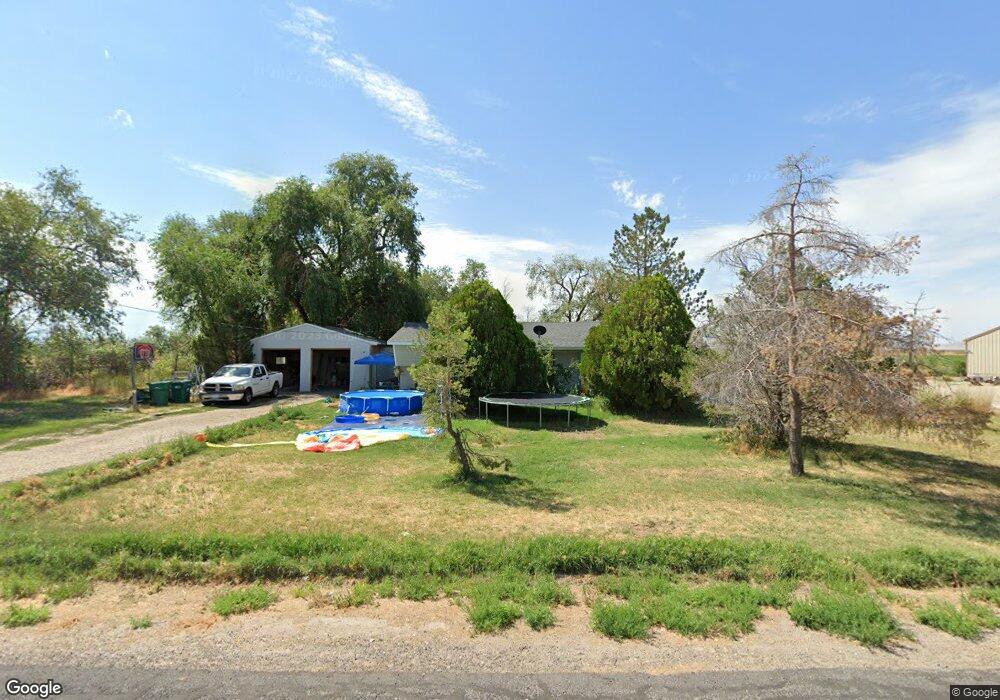
5199 W 1925 N Hooper, UT 84315
Estimated Value: $458,000 - $532,000
2
Beds
1
Bath
1,448
Sq Ft
$333/Sq Ft
Est. Value
About This Home
This home is located at 5199 W 1925 N, Hooper, UT 84315 and is currently estimated at $482,891, approximately $333 per square foot. 5199 W 1925 N is a home located in Davis County with nearby schools including West Point School, West Point Junior High School, and Syracuse High School.
Ownership History
Date
Name
Owned For
Owner Type
Purchase Details
Closed on
Jul 16, 2001
Sold by
Stocks Sanford W
Bought by
Stocks Robert A
Current Estimated Value
Purchase Details
Closed on
Jun 15, 2001
Sold by
Stocks Robert A
Bought by
Stocks Sanford W
Purchase Details
Closed on
Feb 5, 1999
Sold by
Stocks Robert A and Stocks Sanford W
Bought by
Stocks Robert A
Home Financials for this Owner
Home Financials are based on the most recent Mortgage that was taken out on this home.
Original Mortgage
$84,000
Outstanding Balance
$19,533
Interest Rate
6.79%
Estimated Equity
$463,358
Purchase Details
Closed on
Aug 24, 1998
Sold by
Stocks Robert A
Bought by
Stocks Robert A and Stocks Sanford W
Home Financials for this Owner
Home Financials are based on the most recent Mortgage that was taken out on this home.
Original Mortgage
$68,250
Interest Rate
6.91%
Create a Home Valuation Report for This Property
The Home Valuation Report is an in-depth analysis detailing your home's value as well as a comparison with similar homes in the area
Home Values in the Area
Average Home Value in this Area
Purchase History
| Date | Buyer | Sale Price | Title Company |
|---|---|---|---|
| Stocks Robert A | -- | Bonneville Title Company Inc | |
| Stocks Sanford W | -- | Bonneville Title Company Inc | |
| Stocks Robert A | -- | Associated Title Company | |
| Stocks Robert A | -- | Home Abst & Title Co | |
| Stocks Robert A | -- | Home Abst & Title Co |
Source: Public Records
Mortgage History
| Date | Status | Borrower | Loan Amount |
|---|---|---|---|
| Open | Stocks Robert A | $84,000 | |
| Previous Owner | Stocks Robert A | $68,250 |
Source: Public Records
Tax History
| Year | Tax Paid | Tax Assessment Tax Assessment Total Assessment is a certain percentage of the fair market value that is determined by local assessors to be the total taxable value of land and additions on the property. | Land | Improvement |
|---|---|---|---|---|
| 2025 | $1,953 | $220,000 | $176,389 | $43,611 |
| 2024 | $1,927 | $222,750 | $158,400 | $64,350 |
| 2023 | $1,897 | $390,000 | $223,253 | $166,747 |
| 2022 | $2,020 | $225,500 | $124,034 | $101,466 |
| 2021 | $1,814 | $306,000 | $164,587 | $141,413 |
| 2020 | $1,656 | $266,000 | $143,259 | $122,741 |
| 2019 | $1,664 | $259,000 | $137,483 | $121,517 |
| 2018 | $1,404 | $220,000 | $126,878 | $93,122 |
| 2016 | $1,249 | $102,960 | $49,542 | $53,418 |
| 2015 | $1,179 | $92,345 | $49,542 | $42,803 |
| 2014 | $1,215 | $97,034 | $49,542 | $47,492 |
| 2013 | -- | $90,424 | $42,329 | $48,095 |
Source: Public Records
Map
Nearby Homes
- 2084 N 4500 W
- 1156 N 5150 W
- 4396 W 1825 N Unit 112
- 4382 W 1825 N Unit 110
- 4348 W 1825 N Unit 103
- 6242 W 5950 S
- 4901 W 650 N
- 4719 W 650 N
- 3828 W 2300 N
- 3826 W 2350 N
- 3816 W 2300 N
- 0 W 5500 S
- 477 N 4500 W
- 2444 N Hooded Crane Cir Unit 11
- 3656 W 1800 N
- 3721 W 825 N Unit 101
- 2000 Garden Plan at Cranefield Estates - Collection
- 2400 Garden Plan at Cranefield Estates - Collection
- 2500 Farmhouse Plan at Cranefield Estates - Collection
- 1700 Farmhouse Plan at Cranefield Estates - Collection
Your Personal Tour Guide
Ask me questions while you tour the home.