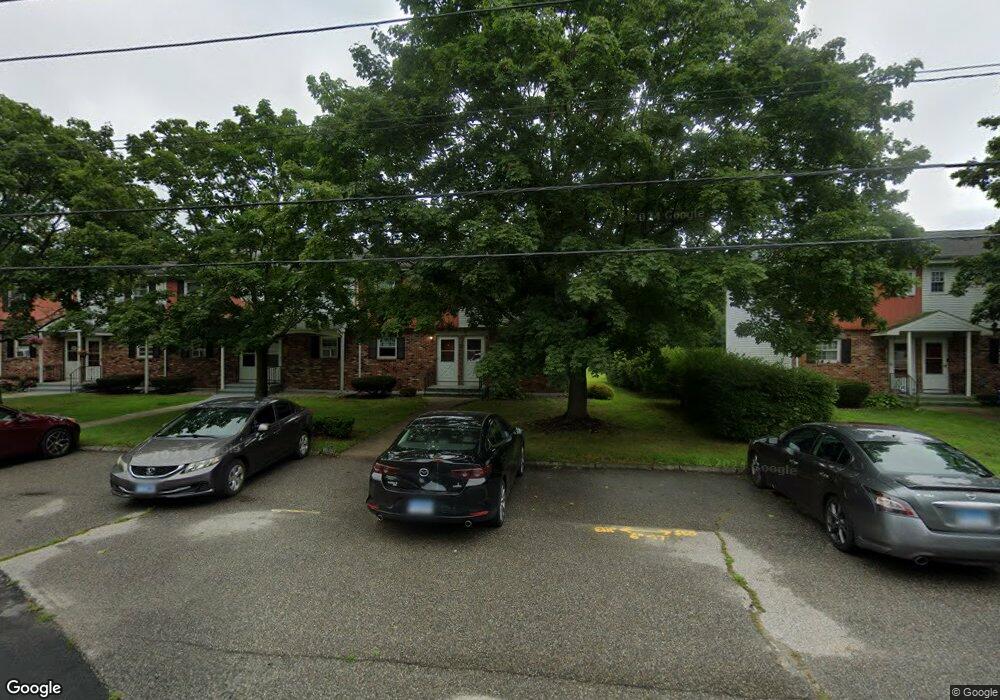
52 Athol St Danielson, CT 06239
Estimated Value: $199,000 - $212,000
2
Beds
2
Baths
896
Sq Ft
$230/Sq Ft
Est. Value
About This Home
This home is located at 52 Athol St, Danielson, CT 06239 and is currently estimated at $206,390, approximately $230 per square foot. 52 Athol St is a home located in Windham County with nearby schools including Killingly Central School, Killingly Memorial School, and Killingly Intermediate School.
Ownership History
Date
Name
Owned For
Owner Type
Purchase Details
Closed on
Jun 17, 2005
Sold by
Wallace Brenda
Bought by
Marchesseault Prudence
Current Estimated Value
Purchase Details
Closed on
Dec 3, 2002
Sold by
Etheridge Gregory H and Etheridge Monica L
Bought by
Wallace Brenda
Home Financials for this Owner
Home Financials are based on the most recent Mortgage that was taken out on this home.
Original Mortgage
$56,900
Interest Rate
6.16%
Create a Home Valuation Report for This Property
The Home Valuation Report is an in-depth analysis detailing your home's value as well as a comparison with similar homes in the area
Home Values in the Area
Average Home Value in this Area
Purchase History
| Date | Buyer | Sale Price | Title Company |
|---|---|---|---|
| Marchesseault Prudence | $115,900 | -- | |
| Marchesseault Prudence | $115,900 | -- | |
| Wallace Brenda | $58,300 | -- | |
| Wallace Brenda | $58,300 | -- |
Source: Public Records
Mortgage History
| Date | Status | Borrower | Loan Amount |
|---|---|---|---|
| Previous Owner | Wallace Brenda | $56,900 |
Source: Public Records
Tax History
| Year | Tax Paid | Tax Assessment Tax Assessment Total Assessment is a certain percentage of the fair market value that is determined by local assessors to be the total taxable value of land and additions on the property. | Land | Improvement |
|---|---|---|---|---|
| 2025 | $2,638 | $105,310 | $0 | $105,310 |
| 2024 | $2,518 | $105,310 | $0 | $105,310 |
| 2023 | $1,797 | $56,000 | $0 | $56,000 |
| 2022 | $1,691 | $56,000 | $0 | $56,000 |
| 2021 | $1,691 | $56,000 | $0 | $56,000 |
| 2020 | $1,663 | $56,000 | $0 | $56,000 |
| 2019 | $1,681 | $56,000 | $0 | $56,000 |
| 2017 | $1,716 | $53,200 | $0 | $53,200 |
| 2016 | $1,716 | $53,200 | $0 | $53,200 |
| 2015 | $1,682 | $53,200 | $0 | $53,200 |
| 2014 | $1,642 | $53,200 | $0 | $53,200 |
Source: Public Records
Map
Nearby Homes
Your Personal Tour Guide
Ask me questions while you tour the home.