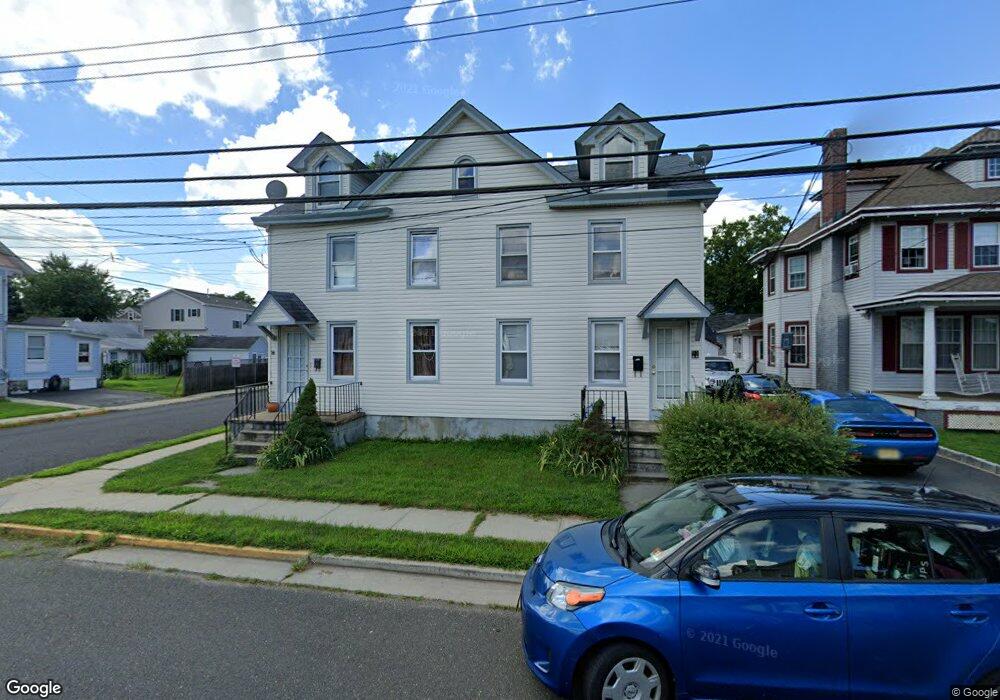
52 Atlantic St Unit 54 Keyport, NJ 07735
Estimated Value: $602,000 - $774,000
5
Beds
2
Baths
3,011
Sq Ft
$222/Sq Ft
Est. Value
About This Home
This home is located at 52 Atlantic St Unit 54, Keyport, NJ 07735 and is currently estimated at $668,628, approximately $222 per square foot. 52 Atlantic St Unit 54 is a home located in Monmouth County with nearby schools including Keyport Central School, Keyport High School, and Icob Academy.
Ownership History
Date
Name
Owned For
Owner Type
Purchase Details
Closed on
Jun 25, 2024
Sold by
Druam Nikolas
Bought by
Drumm Elena
Current Estimated Value
Purchase Details
Closed on
Jun 29, 2006
Sold by
Chan Kan Chuen
Bought by
Drumm Nikolas
Home Financials for this Owner
Home Financials are based on the most recent Mortgage that was taken out on this home.
Original Mortgage
$348,000
Interest Rate
6.71%
Mortgage Type
Commercial
Create a Home Valuation Report for This Property
The Home Valuation Report is an in-depth analysis detailing your home's value as well as a comparison with similar homes in the area
Home Values in the Area
Average Home Value in this Area
Purchase History
| Date | Buyer | Sale Price | Title Company |
|---|---|---|---|
| Drumm Elena | $43,000 | Stewart Title | |
| Drumm Elena | $43,000 | Stewart Title | |
| Drumm Nikolas | $435,000 | -- |
Source: Public Records
Mortgage History
| Date | Status | Borrower | Loan Amount |
|---|---|---|---|
| Previous Owner | Drumm Nikolas | $348,000 |
Source: Public Records
Tax History Compared to Growth
Tax History
| Year | Tax Paid | Tax Assessment Tax Assessment Total Assessment is a certain percentage of the fair market value that is determined by local assessors to be the total taxable value of land and additions on the property. | Land | Improvement |
|---|---|---|---|---|
| 2025 | $9,868 | $520,000 | $192,700 | $327,300 |
| 2024 | $9,755 | $476,700 | $165,500 | $311,200 |
| 2023 | $9,755 | $443,800 | $150,400 | $293,400 |
| 2022 | $8,806 | $385,800 | $130,800 | $255,000 |
| 2021 | $8,806 | $348,900 | $121,100 | $227,800 |
| 2020 | $8,471 | $333,100 | $116,400 | $216,700 |
| 2019 | $8,216 | $323,600 | $111,900 | $211,700 |
| 2018 | $8,239 | $316,900 | $118,800 | $198,100 |
| 2017 | $8,144 | $312,400 | $114,300 | $198,100 |
| 2016 | $7,817 | $302,400 | $114,300 | $188,100 |
| 2015 | $7,438 | $286,400 | $100,800 | $185,600 |
| 2014 | $8,408 | $326,900 | $78,300 | $248,600 |
Source: Public Records
Map
Nearby Homes