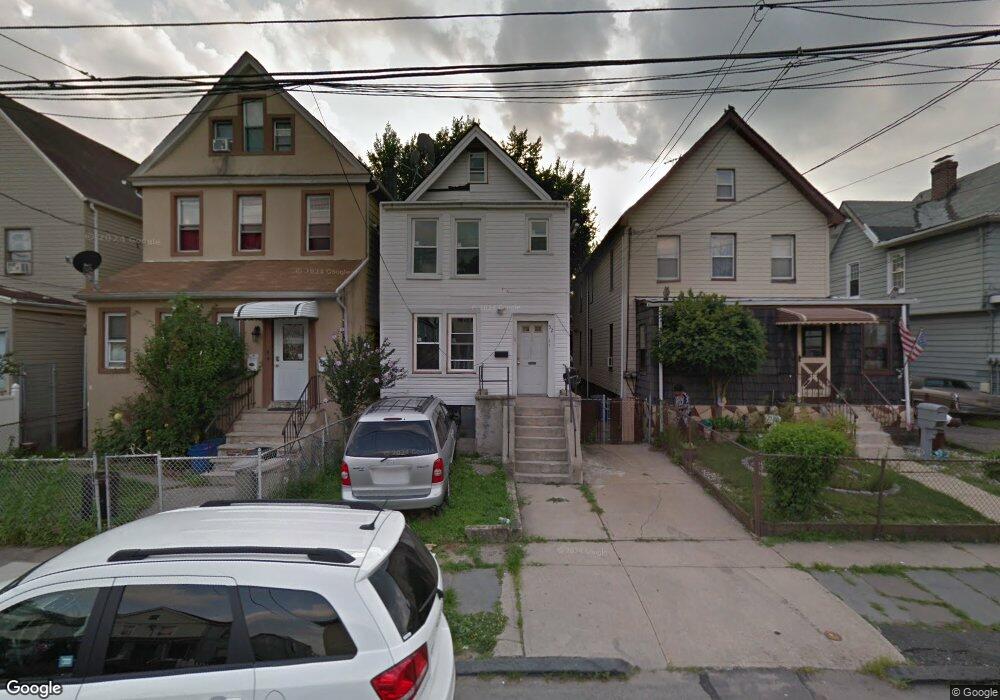
52 Barker St Staten Island, NY 10310
West Brighton NeighborhoodEstimated Value: $518,000 - $664,000
3
Beds
2
Baths
1,573
Sq Ft
$365/Sq Ft
Est. Value
About This Home
This home is located at 52 Barker St, Staten Island, NY 10310 and is currently estimated at $574,427, approximately $365 per square foot. 52 Barker St is a home located in Richmond County with nearby schools including P.S. 18 John G. Whittier, Intermediate School 27, and Susan E Wagner High School.
Ownership History
Date
Name
Owned For
Owner Type
Purchase Details
Closed on
Jun 22, 2006
Sold by
Nwosu Livinus and Nwosu Ngozi
Bought by
Nwosu Ngozi
Current Estimated Value
Home Financials for this Owner
Home Financials are based on the most recent Mortgage that was taken out on this home.
Original Mortgage
$297,500
Outstanding Balance
$183,271
Interest Rate
7.44%
Mortgage Type
New Conventional
Estimated Equity
$391,156
Purchase Details
Closed on
Feb 13, 2004
Sold by
Cyrus Terrell and Cyrus Sara
Bought by
Nwosu Livinus and Nwosu Ngozi
Home Financials for this Owner
Home Financials are based on the most recent Mortgage that was taken out on this home.
Original Mortgage
$249,375
Interest Rate
7.2%
Mortgage Type
Purchase Money Mortgage
Purchase Details
Closed on
Feb 11, 1999
Sold by
First Home Properties Corp
Bought by
Cyrus Terrell and Cyrus Sara
Home Financials for this Owner
Home Financials are based on the most recent Mortgage that was taken out on this home.
Original Mortgage
$105,850
Interest Rate
7.02%
Mortgage Type
FHA
Purchase Details
Closed on
Jun 25, 1998
Sold by
Citibank Na
Bought by
First Home Properties Corp
Create a Home Valuation Report for This Property
The Home Valuation Report is an in-depth analysis detailing your home's value as well as a comparison with similar homes in the area
Home Values in the Area
Average Home Value in this Area
Purchase History
| Date | Buyer | Sale Price | Title Company |
|---|---|---|---|
| Nwosu Ngozi | -- | Fidelity National Title Insu | |
| Nwosu Livinus | $262,500 | First American Title Insuran | |
| Cyrus Terrell | $107,500 | Fidelity National Title Ins | |
| First Home Properties Corp | $53,000 | -- |
Source: Public Records
Mortgage History
| Date | Status | Borrower | Loan Amount |
|---|---|---|---|
| Open | Nwosu Ngozi | $297,500 | |
| Closed | Nwosu Livinus | $249,375 | |
| Previous Owner | Cyrus Terrell | $105,850 |
Source: Public Records
Tax History Compared to Growth
Tax History
| Year | Tax Paid | Tax Assessment Tax Assessment Total Assessment is a certain percentage of the fair market value that is determined by local assessors to be the total taxable value of land and additions on the property. | Land | Improvement |
|---|---|---|---|---|
| 2025 | $4,216 | $32,100 | $5,985 | $26,115 |
| 2024 | $2,222 | $34,260 | $5,608 | $28,652 |
| 2023 | $2,223 | $22,225 | $5,974 | $16,251 |
| 2022 | $3,899 | $26,160 | $8,580 | $17,580 |
| 2021 | $3,860 | $21,660 | $8,580 | $13,080 |
| 2020 | $3,747 | $18,660 | $8,580 | $10,080 |
| 2019 | $3,950 | $20,280 | $8,580 | $11,700 |
| 2018 | $3,665 | $19,440 | $8,580 | $10,860 |
| 2017 | $3,571 | $18,987 | $7,627 | $11,360 |
| 2016 | $3,271 | $17,914 | $8,399 | $9,515 |
| 2015 | $3,011 | $17,914 | $6,390 | $11,524 |
| 2014 | $3,011 | $17,280 | $6,567 | $10,713 |
Source: Public Records
Map
Nearby Homes
- 57 Barker St
- 77 Barker St
- 28 Trinity Place
- 21 Trinity Place
- 1198 Castleton Ave
- 143 Bodine St
- 46 Elizabeth St
- 1064 Castleton Ave
- 173 Clove Rd
- 1836 Richmond Terrace
- 46 Winegar Ln
- 31 Giacomo Ln
- 305 Broadway
- 45 Giacomo Ln
- 718 Henderson Ave
- 698 Henderson Ave
- 699 Henderson Ave
- 24 Wayne St
- 56 South St
- 123 Roe St