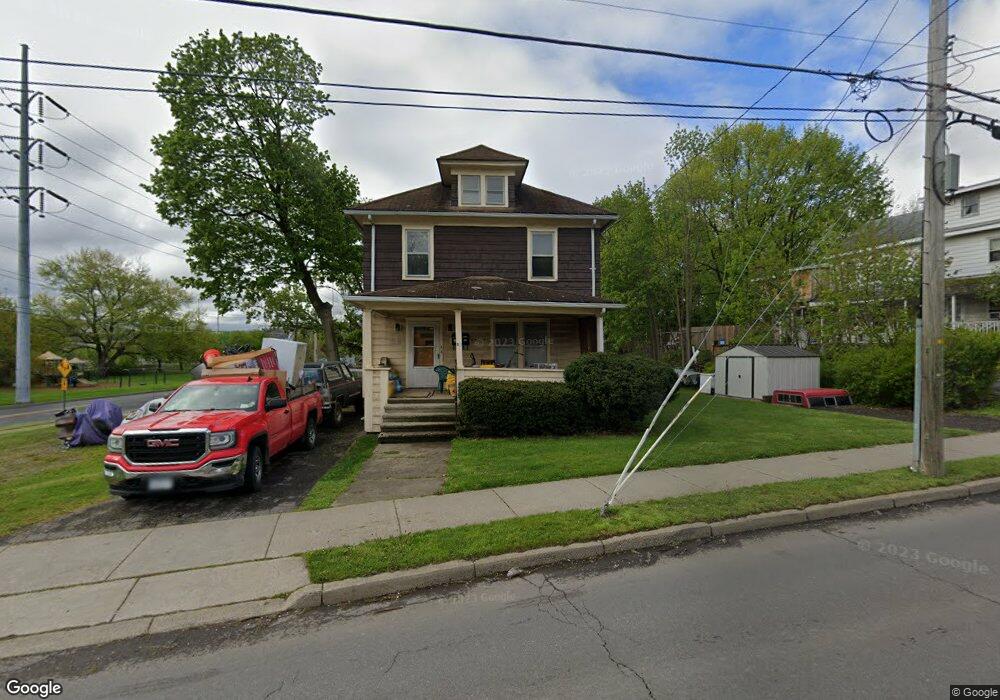
52 Bevier St Binghamton, NY 13901
Northside Binghamton NeighborhoodEstimated Value: $120,419 - $193,000
4
Beds
2
Baths
1,740
Sq Ft
$85/Sq Ft
Est. Value
About This Home
This home is located at 52 Bevier St, Binghamton, NY 13901 and is currently estimated at $147,105, approximately $84 per square foot. 52 Bevier St is a home located in Broome County with nearby schools including Theodore Roosevelt Elementary School, Binghamton High School, and East Middle School.
Ownership History
Date
Name
Owned For
Owner Type
Purchase Details
Closed on
Feb 14, 2017
Sold by
Yenik Robert J
Bought by
Yenik Robert J
Current Estimated Value
Purchase Details
Closed on
Nov 4, 2010
Sold by
Hoch David J
Bought by
Yenik Robert J
Home Financials for this Owner
Home Financials are based on the most recent Mortgage that was taken out on this home.
Original Mortgage
$73,214
Outstanding Balance
$48,256
Interest Rate
4.25%
Mortgage Type
FHA
Estimated Equity
$98,849
Create a Home Valuation Report for This Property
The Home Valuation Report is an in-depth analysis detailing your home's value as well as a comparison with similar homes in the area
Home Values in the Area
Average Home Value in this Area
Purchase History
| Date | Buyer | Sale Price | Title Company |
|---|---|---|---|
| Yenik Robert J | -- | None Available | |
| Yenik Robert J | $70,000 | None Available |
Source: Public Records
Mortgage History
| Date | Status | Borrower | Loan Amount |
|---|---|---|---|
| Open | Yenik Robert J | $73,214 |
Source: Public Records
Tax History
| Year | Tax Paid | Tax Assessment Tax Assessment Total Assessment is a certain percentage of the fair market value that is determined by local assessors to be the total taxable value of land and additions on the property. | Land | Improvement |
|---|---|---|---|---|
| 2024 | $5,421 | $55,000 | $7,300 | $47,700 |
| 2023 | $5,322 | $55,000 | $7,300 | $47,700 |
| 2022 | $5,197 | $55,000 | $7,300 | $47,700 |
| 2021 | $5,138 | $55,000 | $7,300 | $47,700 |
| 2020 | $3,398 | $55,000 | $7,300 | $47,700 |
| 2019 | $1,734 | $55,000 | $7,300 | $47,700 |
| 2018 | $3,313 | $55,000 | $7,300 | $47,700 |
| 2017 | $2,672 | $55,000 | $7,300 | $47,700 |
| 2016 | $2,698 | $55,000 | $7,300 | $47,700 |
| 2015 | $2,971 | $55,000 | $7,300 | $47,700 |
| 2014 | $2,971 | $55,000 | $7,300 | $47,700 |
Source: Public Records
Map
Nearby Homes
Your Personal Tour Guide
Ask me questions while you tour the home.