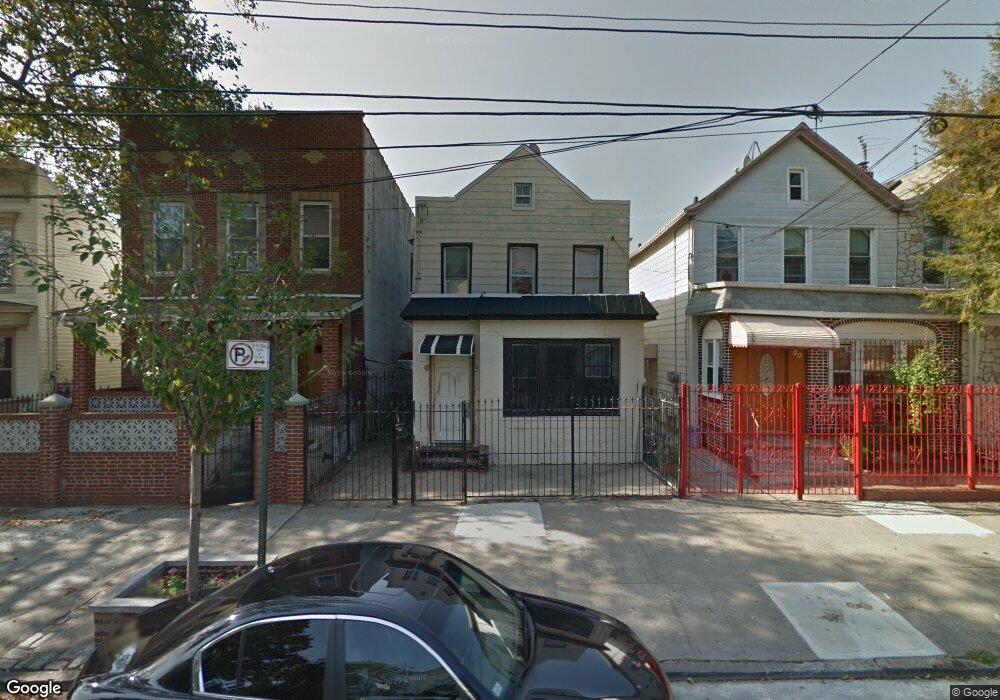
52 Bradford St Unit 1 Brooklyn, NY 11207
Cypress Hills NeighborhoodEstimated Value: $699,000 - $1,071,000
5
Beds
4
Baths
1,120
Sq Ft
$798/Sq Ft
Est. Value
About This Home
This home is located at 52 Bradford St Unit 1, Brooklyn, NY 11207 and is currently estimated at $893,326, approximately $797 per square foot. 52 Bradford St Unit 1 is a home located in Kings County with nearby schools including P.S. 290 - Juan Morel Campos, Vista Academy, and Liberty Avenue Middle School.
Ownership History
Date
Name
Owned For
Owner Type
Purchase Details
Closed on
Jul 26, 2018
Sold by
Lisette Lorenzi and Santana Juan F
Bought by
Ratcliff Aquanna L and Ratcliff Gabriel D
Current Estimated Value
Home Financials for this Owner
Home Financials are based on the most recent Mortgage that was taken out on this home.
Original Mortgage
$851,522
Outstanding Balance
$738,400
Interest Rate
4.62%
Mortgage Type
FHA
Estimated Equity
$154,926
Purchase Details
Closed on
Sep 22, 2017
Sold by
Lorenzi Lisette
Bought by
Lorenzi Lisette and Santana Juan F
Purchase Details
Closed on
Oct 30, 2015
Sold by
1171 Kings Realty Llc
Bought by
Lorenzi Lisette
Purchase Details
Closed on
Jul 14, 2015
Sold by
Pnc Bank National Association and % 3815 South West Temple
Bought by
1171 Kings Realty Llc
Purchase Details
Closed on
Aug 22, 2013
Sold by
Otey Charles F Esq
Bought by
National City Bank
Purchase Details
Closed on
Nov 30, 2005
Sold by
Fludd Carlen
Bought by
Kaminsky Vladimir
Purchase Details
Closed on
Apr 13, 2004
Sold by
Gadsden Calvin C
Bought by
Fludd Carlen
Purchase Details
Closed on
Nov 21, 2003
Sold by
Torres Ramona and Torres Rinaldo
Bought by
Gadsden Calvin
Purchase Details
Closed on
Jul 30, 2002
Sold by
Torres Rinaldo and Santana Luis
Bought by
Torres Rinaldo and Torres Ramona
Purchase Details
Closed on
Oct 29, 1999
Sold by
First Home Properties Corp
Bought by
Torres Rinaldo and Santana Luis
Purchase Details
Closed on
Jul 1, 1999
Sold by
Medina Pablo
Bought by
First Home Properties Corp
Create a Home Valuation Report for This Property
The Home Valuation Report is an in-depth analysis detailing your home's value as well as a comparison with similar homes in the area
Home Values in the Area
Average Home Value in this Area
Purchase History
| Date | Buyer | Sale Price | Title Company |
|---|---|---|---|
| Ratcliff Aquanna L | $789,000 | -- | |
| Ratcliff Aquanna L | $789,000 | -- | |
| Ratcliff Aquanna L | $789,000 | -- | |
| Ratcliff Aquanna L | $789,000 | -- | |
| Lorenzi Lisette | -- | -- | |
| Lorenzi Lisette | -- | -- | |
| Lorenzi Lisette | -- | -- | |
| Lorenzi Lisette | -- | -- | |
| Lorenzi Lisette | $570,000 | -- | |
| Lorenzi Lisette | $570,000 | -- | |
| Lorenzi Lisette | $570,000 | -- | |
| Lorenzi Lisette | $570,000 | -- | |
| 1171 Kings Realty Llc | $264,654 | -- | |
| 1171 Kings Realty Llc | $264,654 | -- | |
| 1171 Kings Realty Llc | $264,654 | -- | |
| 1171 Kings Realty Llc | $264,654 | -- | |
| National City Bank | $467,557 | -- | |
| National City Bank | $467,557 | -- | |
| National City Bank | $467,557 | -- | |
| National City Bank | $467,557 | -- | |
| Kaminsky Vladimir | -- | -- | |
| Kaminsky Vladimir | -- | -- | |
| Kaminsky Vladimir | -- | -- | |
| Kaminsky Vladimir | -- | -- | |
| Fludd Carlen | $365,000 | -- | |
| Fludd Carlen | $365,000 | -- | |
| Fludd Carlen | $365,000 | -- | |
| Fludd Carlen | $365,000 | -- | |
| Gadsden Calvin | $257,500 | -- | |
| Gadsden Calvin | $257,500 | -- | |
| Gadsden Calvin | $257,500 | -- | |
| Gadsden Calvin | $257,500 | -- | |
| Torres Rinaldo | -- | -- | |
| Torres Rinaldo | -- | -- | |
| Torres Rinaldo | -- | -- | |
| Torres Rinaldo | -- | -- | |
| Torres Rinaldo | $83,000 | Fidelity National Title Ins | |
| Torres Rinaldo | $83,000 | Fidelity National Title Ins | |
| Torres Rinaldo | $83,000 | Fidelity National Title Ins | |
| Torres Rinaldo | $83,000 | Fidelity National Title Ins | |
| First Home Properties Corp | $120,000 | First American Title Ins Co | |
| First Home Properties Corp | $120,000 | First American Title Ins Co | |
| First Home Properties Corp | $120,000 | First American Title Ins Co | |
| First Home Properties Corp | $120,000 | First American Title Ins Co |
Source: Public Records
Mortgage History
| Date | Status | Borrower | Loan Amount |
|---|---|---|---|
| Open | Ratcliff Aquanna L | $851,522 | |
| Closed | Ratcliff Aquanna L | $851,522 |
Source: Public Records
Tax History Compared to Growth
Tax History
| Year | Tax Paid | Tax Assessment Tax Assessment Total Assessment is a certain percentage of the fair market value that is determined by local assessors to be the total taxable value of land and additions on the property. | Land | Improvement |
|---|---|---|---|---|
| 2025 | $2,770 | $50,640 | $15,420 | $35,220 |
| 2024 | $2,770 | $40,020 | $15,420 | $24,600 |
| 2023 | $2,648 | $48,540 | $15,420 | $33,120 |
| 2022 | $2,460 | $41,940 | $15,420 | $26,520 |
| 2021 | $2,450 | $32,400 | $15,420 | $16,980 |
| 2020 | $1,218 | $33,840 | $15,420 | $18,420 |
| 2019 | $2,404 | $33,840 | $15,420 | $18,420 |
| 2018 | $2,215 | $10,866 | $4,631 | $6,235 |
| 2017 | $2,093 | $10,268 | $5,342 | $4,926 |
| 2016 | $1,940 | $9,703 | $5,110 | $4,593 |
| 2015 | $1,168 | $9,703 | $7,303 | $2,400 |
| 2014 | $1,168 | $9,578 | $8,010 | $1,568 |
Source: Public Records
Map
Nearby Homes
- 57 Wyona St
- 2735 Fulton St
- 52 Bradford St
- 90 Wyona St
- 168 Miller Ave
- 107 Miller Ave
- 52 van Siclen Ave
- 48 van Siclen Ave
- 153 Hendrix St
- 159 Wyona St
- 14 van Siclen Ct
- 178 Highland Blvd
- 174 van Siclen Ave
- 2830 Fulton St
- 153 Highland Blvd
- 87 Schenck Ave
- 4 Crosby Ave
- 224 Highland Blvd Unit 710
- 2825 Atlantic Ave
- 124 Pennsylvania Ave