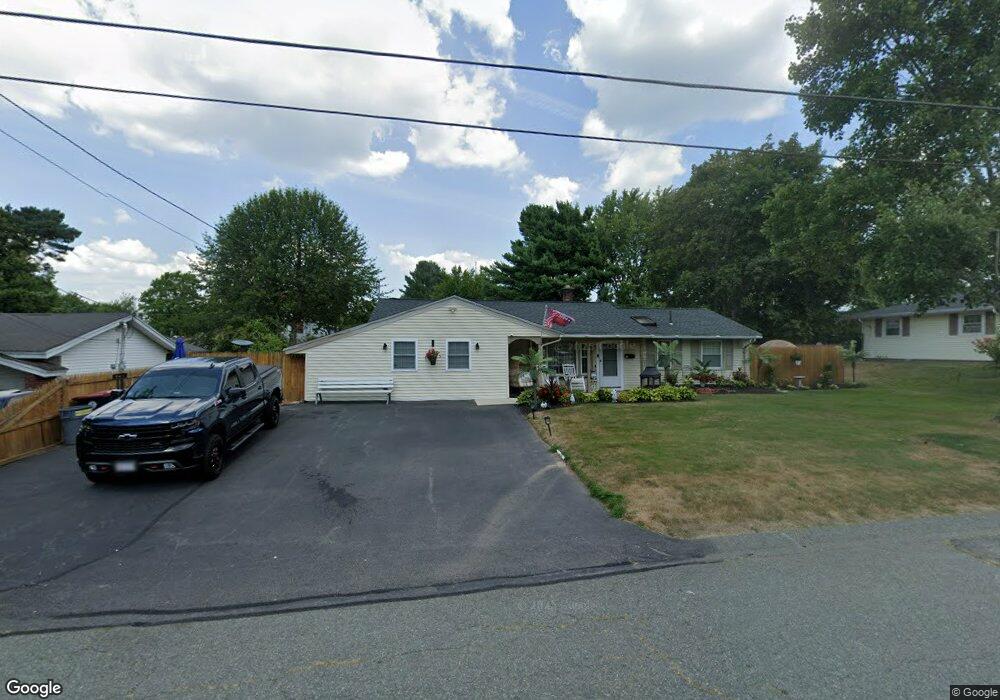
52 Brookfield Dr Brockton, MA 02302
Montello NeighborhoodEstimated Value: $478,757 - $533,000
4
Beds
1
Bath
1,576
Sq Ft
$318/Sq Ft
Est. Value
About This Home
This home is located at 52 Brookfield Dr, Brockton, MA 02302 and is currently estimated at $501,689, approximately $318 per square foot. 52 Brookfield Dr is a home located in Plymouth County with nearby schools including Brookfield Elementary School, Mary E. Baker Elementary School, and Downey Elementary School.
Ownership History
Date
Name
Owned For
Owner Type
Purchase Details
Closed on
Dec 11, 2014
Sold by
Mccarthy-Macwilliams L G and Macwilliams Robert J
Bought by
Mccarthy-Macwilliams L G
Current Estimated Value
Purchase Details
Closed on
Dec 12, 2011
Sold by
Resilient Investments
Bought by
Macwilliams Linda G and Macwilliams Robert J
Home Financials for this Owner
Home Financials are based on the most recent Mortgage that was taken out on this home.
Original Mortgage
$162,450
Interest Rate
4.09%
Mortgage Type
Purchase Money Mortgage
Purchase Details
Closed on
Oct 6, 2011
Sold by
Moran Karen Marie and Wells Fargo Bank Na
Bought by
Resilient Investments
Home Financials for this Owner
Home Financials are based on the most recent Mortgage that was taken out on this home.
Original Mortgage
$130,226
Interest Rate
4.2%
Mortgage Type
Purchase Money Mortgage
Purchase Details
Closed on
Oct 12, 1992
Sold by
Luinis Ft
Bought by
Moran Steven J and Moran Karen M
Create a Home Valuation Report for This Property
The Home Valuation Report is an in-depth analysis detailing your home's value as well as a comparison with similar homes in the area
Home Values in the Area
Average Home Value in this Area
Purchase History
| Date | Buyer | Sale Price | Title Company |
|---|---|---|---|
| Mccarthy-Macwilliams L G | -- | -- | |
| Macwilliams Linda G | $171,000 | -- | |
| Resilient Investments | $101,000 | -- | |
| Resilient Investments | $101,000 | -- | |
| Moran Steven J | $96,000 | -- |
Source: Public Records
Mortgage History
| Date | Status | Borrower | Loan Amount |
|---|---|---|---|
| Previous Owner | Macwilliams Linda G | $162,450 | |
| Previous Owner | Resilient Investments | $130,226 | |
| Previous Owner | Moran Steven J | $42,000 | |
| Previous Owner | Moran Steven J | $228,000 | |
| Previous Owner | Moran Steven J | $153,500 |
Source: Public Records
Tax History
| Year | Tax Paid | Tax Assessment Tax Assessment Total Assessment is a certain percentage of the fair market value that is determined by local assessors to be the total taxable value of land and additions on the property. | Land | Improvement |
|---|---|---|---|---|
| 2025 | $4,776 | $394,400 | $159,700 | $234,700 |
| 2024 | $4,678 | $389,200 | $159,700 | $229,500 |
| 2023 | $4,482 | $345,300 | $110,000 | $235,300 |
| 2022 | $4,092 | $292,900 | $100,000 | $192,900 |
| 2021 | $3,957 | $272,900 | $92,700 | $180,200 |
| 2020 | $4,006 | $264,400 | $81,400 | $183,000 |
| 2019 | $3,624 | $233,200 | $77,600 | $155,600 |
| 2018 | $3,577 | $222,700 | $77,600 | $145,100 |
| 2017 | $3,152 | $195,800 | $77,600 | $118,200 |
| 2016 | $2,998 | $172,700 | $74,000 | $98,700 |
| 2015 | $2,870 | $158,100 | $74,000 | $84,100 |
| 2014 | $2,855 | $157,500 | $74,000 | $83,500 |
Source: Public Records
Map
Nearby Homes
- 275 Jon Dr
- 170 Elsie Rd
- 45 Braintree Ave
- 40 Christopher Rd
- 133 Ardsley Cir
- 1004 S Franklin St
- 61 Kent St
- 265 Winter St
- 215 North Ave
- 12 Hamilton Way
- 105 Oscar Ave
- 719 S Franklin St Unit C Block 1
- 81 Dixon Rd
- 89 Dixon Rd
- 18 Banks St
- 52 Quincy St
- 31 Atlanta St
- 14 Leonard Ln
- 40 Alphonse Rd
- 29 Saint Casimir Ave
Your Personal Tour Guide
Ask me questions while you tour the home.