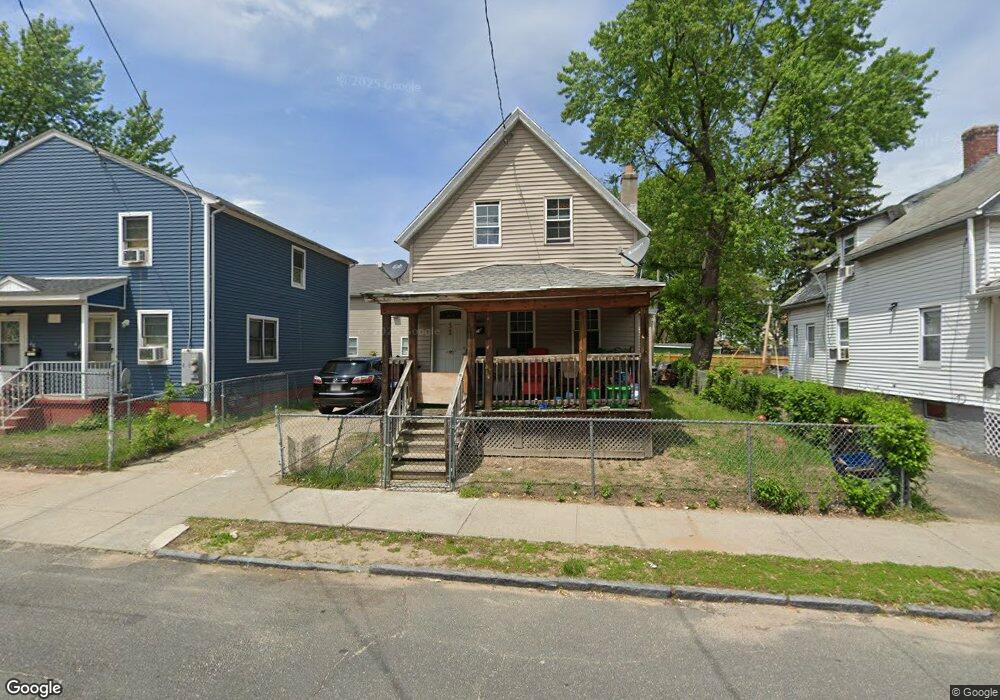
52 Burr St Springfield, MA 01109
Bay NeighborhoodEstimated Value: $182,000 - $246,000
2
Beds
1
Bath
945
Sq Ft
$224/Sq Ft
Est. Value
About This Home
This home is located at 52 Burr St, Springfield, MA 01109 and is currently estimated at $211,518, approximately $223 per square foot. 52 Burr St is a home located in Hampden County with nearby schools including Rebecca M Johnson School, John F. Kennedy Academy, and Springfield High School of Science and Technology.
Ownership History
Date
Name
Owned For
Owner Type
Purchase Details
Closed on
Feb 11, 2011
Sold by
Bridgers Ronald
Bought by
Springfield City Of
Current Estimated Value
Purchase Details
Closed on
May 30, 2007
Sold by
Thomas Hoover and Gregory Lucille
Bought by
Bridgers Ronald
Home Financials for this Owner
Home Financials are based on the most recent Mortgage that was taken out on this home.
Original Mortgage
$70,000
Interest Rate
6.24%
Mortgage Type
Purchase Money Mortgage
Create a Home Valuation Report for This Property
The Home Valuation Report is an in-depth analysis detailing your home's value as well as a comparison with similar homes in the area
Home Values in the Area
Average Home Value in this Area
Purchase History
| Date | Buyer | Sale Price | Title Company |
|---|---|---|---|
| Springfield City Of | $1,840 | -- | |
| Bridgers Ronald | $17,000 | -- |
Source: Public Records
Mortgage History
| Date | Status | Borrower | Loan Amount |
|---|---|---|---|
| Previous Owner | Bridgers Ronald | $70,000 |
Source: Public Records
Tax History
| Year | Tax Paid | Tax Assessment Tax Assessment Total Assessment is a certain percentage of the fair market value that is determined by local assessors to be the total taxable value of land and additions on the property. | Land | Improvement |
|---|---|---|---|---|
| 2025 | $2,346 | $149,600 | $28,200 | $121,400 |
| 2024 | $1,932 | $120,300 | $28,200 | $92,100 |
| 2023 | $1,610 | $94,400 | $25,700 | $68,700 |
| 2022 | $1,622 | $86,200 | $24,000 | $62,200 |
| 2021 | $1,474 | $78,000 | $21,800 | $56,200 |
| 2020 | $1,412 | $72,300 | $21,800 | $50,500 |
| 2019 | $1,500 | $76,200 | $21,800 | $54,400 |
| 2018 | $1,395 | $70,900 | $21,800 | $49,100 |
| 2017 | $1,370 | $69,700 | $21,800 | $47,900 |
| 2016 | $1,244 | $63,300 | $21,800 | $41,500 |
| 2015 | $1,265 | $64,300 | $21,800 | $42,500 |
Source: Public Records
Map
Nearby Homes
- 145 Cambridge St
- 65 Montrose St
- 15 Kenyon St
- 46 Mapledell St
- 52-56 Andrew St
- 163 Marion St
- 16 Cambridge St
- 158 Bowles St
- 21 Clifford St
- 15-17 Sycamore St
- 19 Westford Ave
- 16 Amherst St
- 48-50 Dresden St
- 25 Dresden St
- 106 Amherst St
- 148 Yale St
- 283 Wilbraham Rd
- 22-24 Westminster St
- 290 Quincy St
- 107 Dartmouth St
- 46-48 Burr St
- 48 Burr St
- 46 Burr St Unit 48
- 58 Burr St
- 62 Burr St
- 139 Cambridge St
- 70 Burr St Unit 72
- 120 Oak Grove Ave Unit 122
- 93 Montrose St
- 146 Cambridge St
- 92 Mapledell St
- 154 Cambridge St
- 128 Oak Grove Ave Unit 130
- 85 Montrose St
- 86 Mapledell St
- 142 Cambridge St
- 128 Oak Grove Ave
- 130 Oak Grove Ave
- 96 Montrose St
- 95 Mapledell St
Your Personal Tour Guide
Ask me questions while you tour the home.