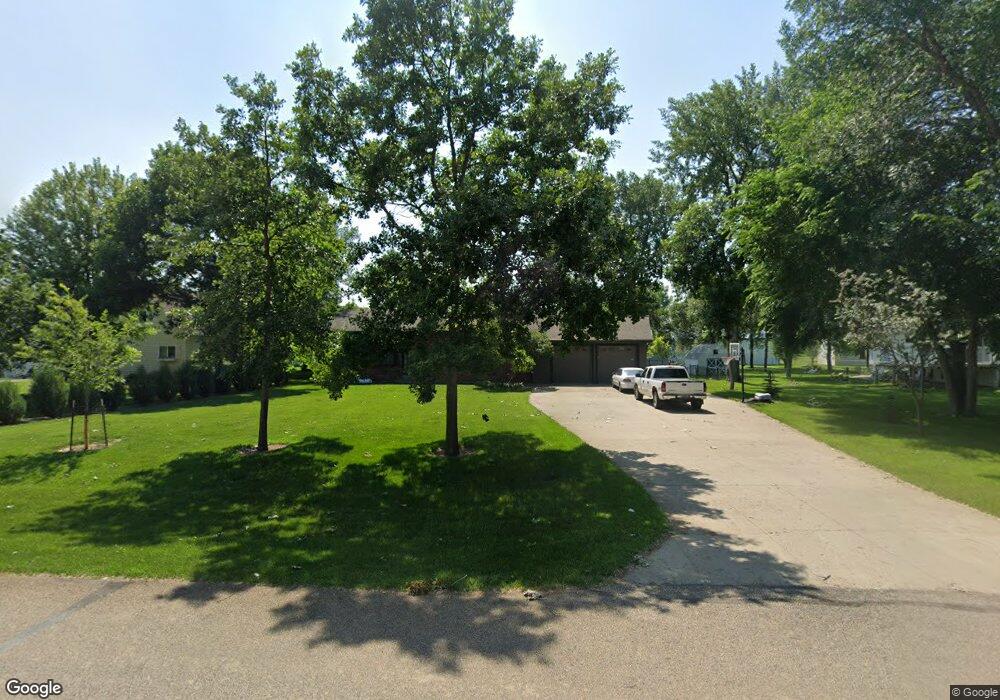
52 Captain Marsh Dr Mandan, ND 58554
Estimated Value: $551,000 - $925,077
Studio
--
Bath
--
Sq Ft
52,272
Sq Ft Lot
About This Home
This home is located at 52 Captain Marsh Dr, Mandan, ND 58554 and is currently estimated at $675,769. 52 Captain Marsh Dr is a home with nearby schools including Lewis & Clark Elementary School, Mandan Middle School, and Mandan High School.
Ownership History
Date
Name
Owned For
Owner Type
Purchase Details
Closed on
Nov 5, 2012
Sold by
Fleck Edna R
Bought by
Fleck Brent L and Fleck Lindsey N
Current Estimated Value
Home Financials for this Owner
Home Financials are based on the most recent Mortgage that was taken out on this home.
Original Mortgage
$176,800
Outstanding Balance
$28,948
Interest Rate
3.32%
Mortgage Type
New Conventional
Estimated Equity
$646,821
Create a Home Valuation Report for This Property
The Home Valuation Report is an in-depth analysis detailing your home's value as well as a comparison with similar homes in the area
Home Values in the Area
Average Home Value in this Area
Purchase History
| Date | Buyer | Sale Price | Title Company |
|---|---|---|---|
| Fleck Brent L | $221,000 | Bismarck Title Company |
Source: Public Records
Mortgage History
| Date | Status | Borrower | Loan Amount |
|---|---|---|---|
| Open | Fleck Brent L | $176,800 |
Source: Public Records
Tax History
| Year | Tax Paid | Tax Assessment Tax Assessment Total Assessment is a certain percentage of the fair market value that is determined by local assessors to be the total taxable value of land and additions on the property. | Land | Improvement |
|---|---|---|---|---|
| 2025 | $2,296 | $217,200 | $19,400 | $197,800 |
| 2024 | $43 | $224,500 | $0 | $0 |
| 2023 | $4,445 | $216,250 | $19,400 | $196,850 |
| 2022 | $3,857 | $188,900 | $20,650 | $168,250 |
| 2021 | $3,519 | $171,900 | $26,150 | $145,750 |
| 2020 | $3,353 | $172,200 | $26,150 | $146,050 |
| 2019 | $3,378 | $168,850 | $0 | $0 |
| 2018 | $3,233 | $168,050 | $26,150 | $141,900 |
| 2017 | $2,379 | $119,950 | $26,150 | $93,800 |
| 2016 | $2,193 | $112,700 | $26,150 | $86,550 |
| 2015 | $2,019 | $104,100 | $26,150 | $77,950 |
| 2014 | $1,810 | $98,100 | $27,450 | $70,650 |
| 2013 | $1,748 | $90,950 | $26,150 | $64,800 |
Source: Public Records
Map
Nearby Homes
- 2109 Bridgeview Ct SE
- 2207 Bridgeview Ct
- 4500 Sundancer Loop SE Unit 2
- 2313 Pirates Loop SE
- 2120 Sundancer Loop SE Unit 5
- 2445 Waterpark Loop SE
- 2454 Waterpark Loop SE
- 1005 W Highland Acres Rd
- 2616 Douglas Place SE
- 2617 Verity Ln SE
- 2601 Douglas Place SE
- 2625 Douglas Place SE
- 1120 Keating Dr
- 3714 Amity Cir SE
- 3834 Gale Cir SE
- 4004 Bayport Place SE
- 3801 Gale Cir SE
- 4103 Bayport Place SE
- 1232 E Coulee Rd
- 3507 24th St SE
- 53 Captain Marsh Dr
- 51 Captain Marsh Dr
- 54 Captain Marsh Dr
- 50 Captain Marsh Dr
- 41 Captain Marsh Dr
- 0 Captain Marsh Dr
- 55 Captain Marsh Dr
- 40 Captain Marsh Dr
- 42 Captain Marsh Dr
- 62 Captain Leach Dr
- 39 Captain Marsh Dr
- 43 Captain Marsh Dr
- 49 Captain Marsh Dr
- 44 Captain Marsh Dr
- 59 Captain Marsh Dr
- 38 Captain Marsh Dr
- 45 Captain Marsh Dr
- 37 Captain Marsh Dr
- 60 Captain Marsh Dr
- 1 Captain Leach Dr
Your Personal Tour Guide
Ask me questions while you tour the home.