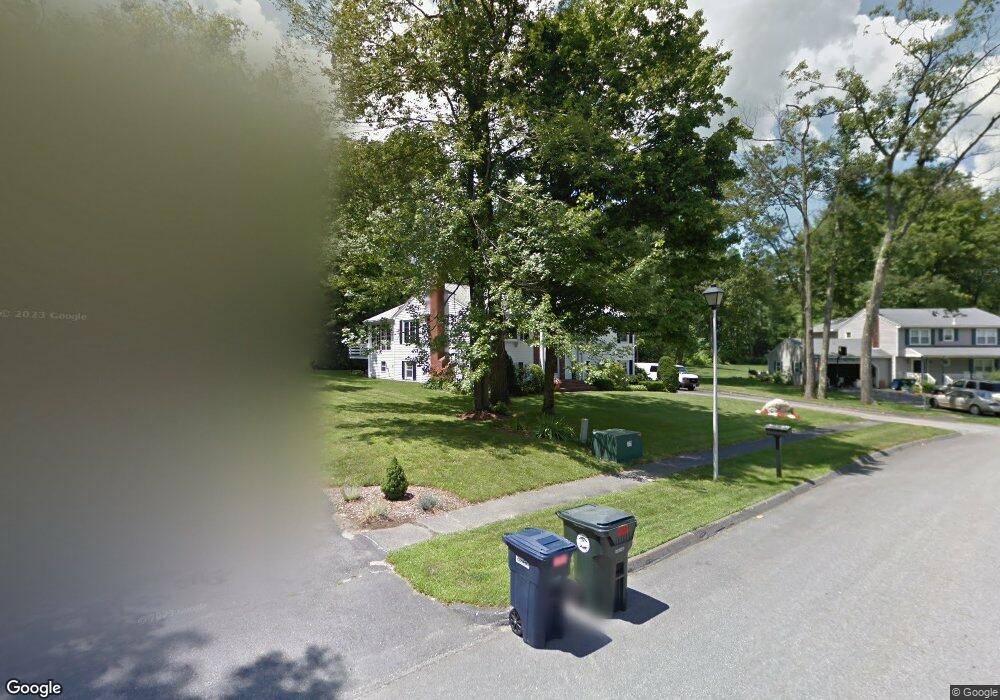
52 Cedar Rd Holden, MA 01520
Estimated Value: $588,144 - $692,000
4
Beds
3
Baths
1,984
Sq Ft
$321/Sq Ft
Est. Value
About This Home
This home is located at 52 Cedar Rd, Holden, MA 01520 and is currently estimated at $637,036, approximately $321 per square foot. 52 Cedar Rd is a home located in Worcester County with nearby schools including Wachusett Regional High School, Abby Kelley Foster Charter Public School, and Bancroft School.
Ownership History
Date
Name
Owned For
Owner Type
Purchase Details
Closed on
Sep 3, 2015
Sold by
Sulham Wayne C and Sulham Kathleen M
Bought by
Sulham Ret
Current Estimated Value
Purchase Details
Closed on
Jan 21, 1977
Bought by
Sulham Ret
Create a Home Valuation Report for This Property
The Home Valuation Report is an in-depth analysis detailing your home's value as well as a comparison with similar homes in the area
Home Values in the Area
Average Home Value in this Area
Purchase History
| Date | Buyer | Sale Price | Title Company |
|---|---|---|---|
| Sulham Ret | -- | -- | |
| Sulham Ret | -- | -- |
Source: Public Records
Mortgage History
| Date | Status | Borrower | Loan Amount |
|---|---|---|---|
| Previous Owner | Sulham Ret | $25,000 | |
| Previous Owner | Sulham Ret | $20,000 | |
| Previous Owner | Sulham Ret | $120,000 |
Source: Public Records
Tax History
| Year | Tax Paid | Tax Assessment Tax Assessment Total Assessment is a certain percentage of the fair market value that is determined by local assessors to be the total taxable value of land and additions on the property. | Land | Improvement |
|---|---|---|---|---|
| 2025 | $7,483 | $539,900 | $171,500 | $368,400 |
| 2024 | $7,974 | $563,500 | $166,500 | $397,000 |
| 2023 | $7,583 | $505,900 | $144,700 | $361,200 |
| 2022 | $7,538 | $455,200 | $113,100 | $342,100 |
| 2021 | $6,689 | $384,400 | $107,600 | $276,800 |
| 2020 | $6,339 | $372,900 | $102,600 | $270,300 |
| 2019 | $6,090 | $349,000 | $102,600 | $246,400 |
| 2018 | $5,739 | $325,900 | $97,700 | $228,200 |
| 2017 | $5,384 | $306,100 | $97,700 | $208,400 |
| 2016 | $5,047 | $292,600 | $93,000 | $199,600 |
| 2015 | $5,182 | $286,000 | $93,000 | $193,000 |
| 2014 | $5,077 | $286,000 | $93,000 | $193,000 |
Source: Public Records
Map
Nearby Homes
- 158 Chester St
- 42 N Worcester Ave
- 27 Tea Party Cir Unit 27
- 218 Holden St
- 12 Tattan Farm Rd
- 4004 Brompton Cir
- 61 Barry Rd
- 46 Barry Rd
- 97 Parkton Ave
- 770 Salisbury St Unit 333
- 47 Harvest Cir
- 23 Gail Dr
- 120 Brattle St
- 270 Brattle St
- 82 Holden St
- 37 Mohave Rd
- 41 Mohave Rd
- 527 Salisbury St
- 25 Chester St
- 667 Grove St
Your Personal Tour Guide
Ask me questions while you tour the home.