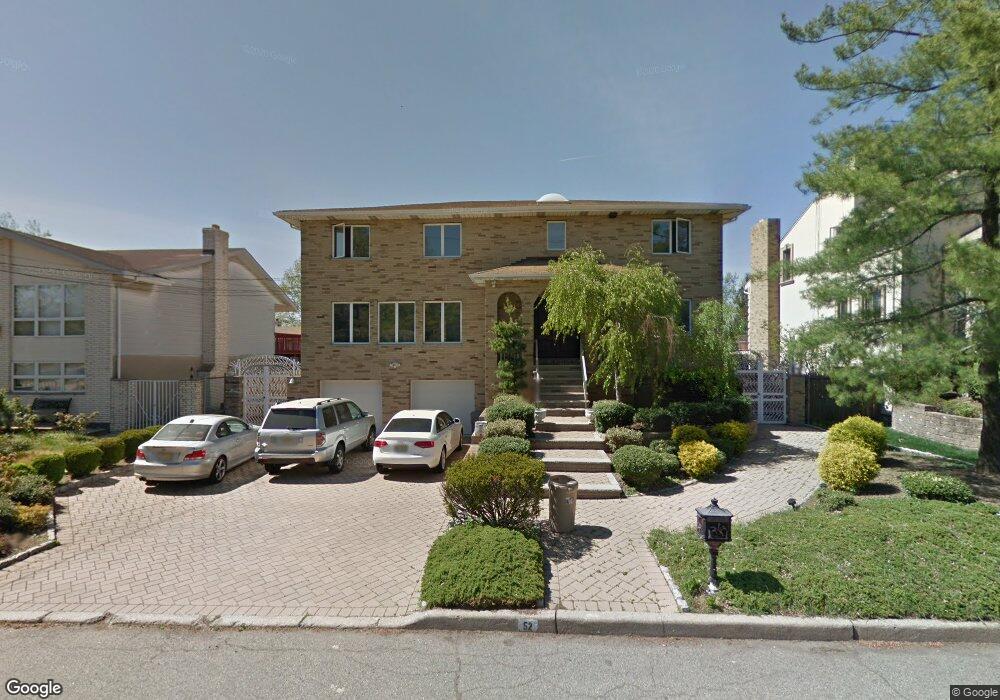
52 Center St Englewood Cliffs, NJ 07632
Estimated Value: $1,567,000 - $1,655,000
--
Bed
--
Bath
3,400
Sq Ft
$469/Sq Ft
Est. Value
About This Home
This home is located at 52 Center St, Englewood Cliffs, NJ 07632 and is currently estimated at $1,596,053, approximately $469 per square foot. 52 Center St is a home located in Bergen County with nearby schools including North Cliff Elementary School, Upper School Elementary School, and Christ the Teacher Academy.
Ownership History
Date
Name
Owned For
Owner Type
Purchase Details
Closed on
Feb 22, 2020
Sold by
Khorozian Hagop and Estate Of Liza Khorozian
Bought by
Khorozian Hagop and Khorozian Jack
Current Estimated Value
Purchase Details
Closed on
May 20, 1999
Sold by
Mozian Souren and Mozian Madeleine
Bought by
Khorozian Liza
Home Financials for this Owner
Home Financials are based on the most recent Mortgage that was taken out on this home.
Original Mortgage
$300,000
Outstanding Balance
$76,296
Interest Rate
6.85%
Estimated Equity
$1,519,757
Create a Home Valuation Report for This Property
The Home Valuation Report is an in-depth analysis detailing your home's value as well as a comparison with similar homes in the area
Home Values in the Area
Average Home Value in this Area
Purchase History
| Date | Buyer | Sale Price | Title Company |
|---|---|---|---|
| Khorozian Hagop | -- | None Available | |
| Khorozian Liza | $500,000 | Commonwealth Land Title Ins |
Source: Public Records
Mortgage History
| Date | Status | Borrower | Loan Amount |
|---|---|---|---|
| Open | Khorozian Liza | $300,000 |
Source: Public Records
Tax History Compared to Growth
Tax History
| Year | Tax Paid | Tax Assessment Tax Assessment Total Assessment is a certain percentage of the fair market value that is determined by local assessors to be the total taxable value of land and additions on the property. | Land | Improvement |
|---|---|---|---|---|
| 2025 | $12,484 | $1,080,900 | $590,600 | $490,300 |
| 2024 | $12,333 | $1,080,900 | $590,600 | $490,300 |
| 2023 | $12,139 | $1,080,900 | $590,600 | $490,300 |
| 2022 | $12,139 | $1,080,900 | $590,600 | $490,300 |
| 2021 | $8,567 | $1,080,900 | $590,600 | $490,300 |
| 2020 | $12,441 | $1,080,900 | $590,600 | $490,300 |
| 2019 | $11,685 | $1,080,900 | $590,600 | $490,300 |
| 2018 | $11,274 | $1,080,900 | $590,600 | $490,300 |
| 2017 | $10,787 | $1,080,900 | $590,600 | $490,300 |
| 2016 | $10,582 | $1,080,900 | $590,600 | $490,300 |
| 2015 | $10,052 | $1,080,900 | $590,600 | $490,300 |
| 2014 | $9,404 | $1,080,900 | $590,600 | $490,300 |
Source: Public Records
Map
Nearby Homes