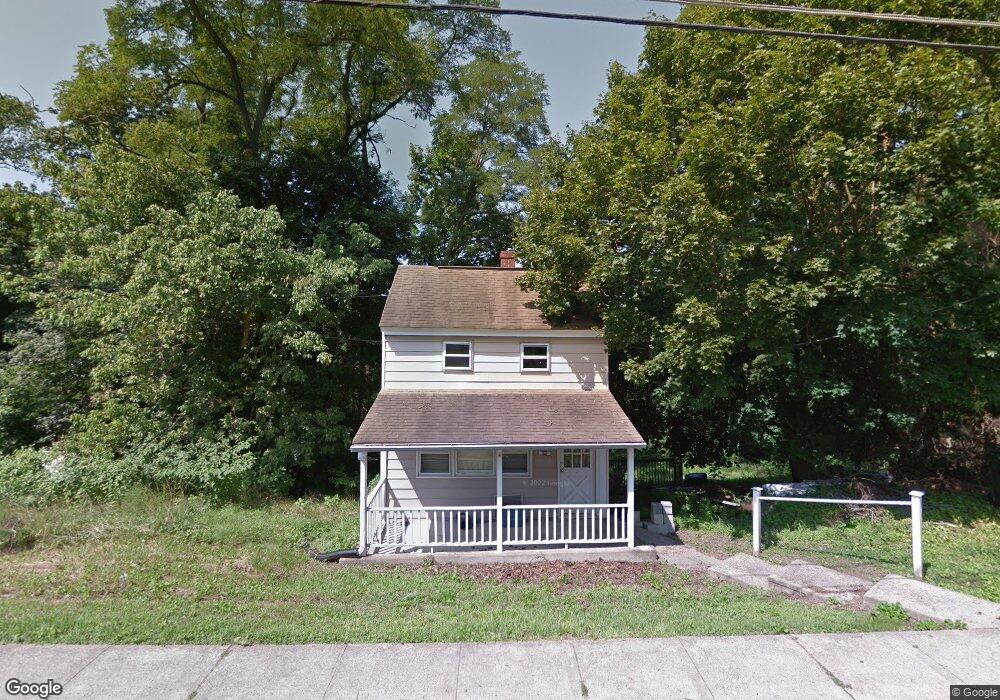
52 Chestnut St Lumberton, NJ 08048
Estimated Value: $107,000 - $256,000
--
Bed
--
Bath
787
Sq Ft
$213/Sq Ft
Est. Value
About This Home
This home is located at 52 Chestnut St, Lumberton, NJ 08048 and is currently estimated at $167,469, approximately $212 per square foot. 52 Chestnut St is a home located in Burlington County with nearby schools including Ashbrook Elementary School, Bobby’s Run School, and Lumberton Middle School.
Ownership History
Date
Name
Owned For
Owner Type
Purchase Details
Closed on
May 29, 2024
Sold by
Wells Fargo Bank Na
Bought by
Ronan Alexa Rae and Ronan Daniel Scott
Current Estimated Value
Purchase Details
Closed on
May 23, 2023
Sold by
Burlington County Sheriff
Bought by
Wells Fargo Bank Na and Thompson
Purchase Details
Closed on
Aug 31, 2004
Sold by
Krachun Michelle and Corl Michelle
Bought by
Thompson George and Thompson Maurice
Create a Home Valuation Report for This Property
The Home Valuation Report is an in-depth analysis detailing your home's value as well as a comparison with similar homes in the area
Home Values in the Area
Average Home Value in this Area
Purchase History
| Date | Buyer | Sale Price | Title Company |
|---|---|---|---|
| Ronan Alexa Rae | $82,000 | Boston National Title Agency | |
| Wells Fargo Bank Na | $132,088 | None Listed On Document | |
| Wells Fargo Bank Na | $132,088 | None Listed On Document | |
| Thompson George | -- | -- |
Source: Public Records
Tax History Compared to Growth
Tax History
| Year | Tax Paid | Tax Assessment Tax Assessment Total Assessment is a certain percentage of the fair market value that is determined by local assessors to be the total taxable value of land and additions on the property. | Land | Improvement |
|---|---|---|---|---|
| 2025 | $2,928 | $110,000 | $70,000 | $40,000 |
| 2024 | $2,753 | $110,000 | $70,000 | $40,000 |
| 2023 | $2,753 | $110,000 | $70,000 | $40,000 |
| 2022 | $2,690 | $110,000 | $70,000 | $40,000 |
| 2021 | $2,681 | $110,000 | $70,000 | $40,000 |
| 2020 | $2,659 | $110,000 | $70,000 | $40,000 |
| 2019 | $2,629 | $110,000 | $70,000 | $40,000 |
| 2018 | $2,589 | $110,000 | $70,000 | $40,000 |
| 2017 | $2,541 | $110,000 | $70,000 | $40,000 |
| 2016 | $2,486 | $110,000 | $70,000 | $40,000 |
| 2015 | $2,467 | $110,000 | $70,000 | $40,000 |
| 2014 | $2,374 | $110,000 | $70,000 | $40,000 |
Source: Public Records
Map
Nearby Homes
- 26 Chestnut St
- 587 Main St
- 15 Wellington Dr
- 10 Whitehaven Dr
- 5 Middleton Dr
- 485 Main St
- 23 Creek Rd
- 71 Kingsbridge Dr
- 20 Jasmine Rd
- 18 Westminster Dr
- 44 Rockland Terrace
- 18 Azalea Dr
- 5 Beulah Ave
- 8 Hollybrook Ave
- 1476 Route 38 Unit 3
- 1476 Route 38 Unit 8
- 25 Sunflower Cir
- 12 Bancroft Ln
- 511 Hamilton Ave
- 11 Abington Way