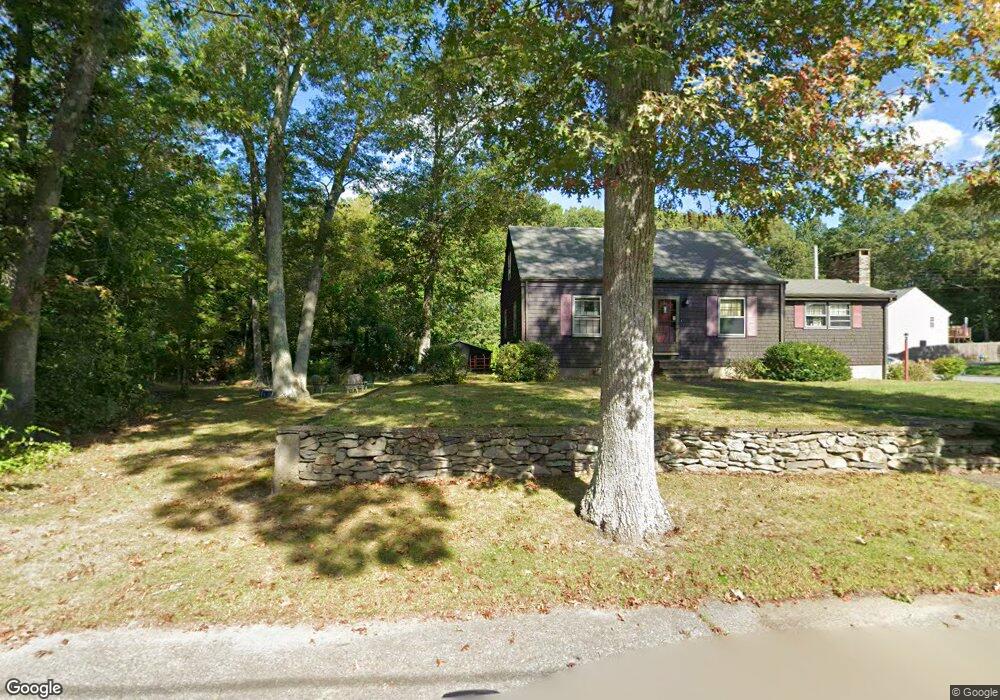
52 Clayton St Attleboro, MA 02703
Estimated Value: $444,460 - $496,000
4
Beds
1
Bath
1,340
Sq Ft
$356/Sq Ft
Est. Value
About This Home
This home is located at 52 Clayton St, Attleboro, MA 02703 and is currently estimated at $477,115, approximately $356 per square foot. 52 Clayton St is a home located in Bristol County with nearby schools including Hill-Roberts Elementary School, Robert J. Coelho Middle School, and Attleboro High School.
Ownership History
Date
Name
Owned For
Owner Type
Purchase Details
Closed on
Sep 15, 2015
Sold by
Sweeney Albert T and Sweeney Matthew T
Bought by
Sweeney Albert T and Sweeney Matthew T
Current Estimated Value
Purchase Details
Closed on
Nov 1, 2011
Sold by
Sweeney Albert T
Bought by
Sweeney Matthew T
Purchase Details
Closed on
Nov 24, 2008
Sold by
Sweeney Albert T and Sweeney Ann S
Bought by
Sweeney Matthew T
Home Financials for this Owner
Home Financials are based on the most recent Mortgage that was taken out on this home.
Original Mortgage
$85,000
Interest Rate
6.03%
Mortgage Type
Purchase Money Mortgage
Create a Home Valuation Report for This Property
The Home Valuation Report is an in-depth analysis detailing your home's value as well as a comparison with similar homes in the area
Home Values in the Area
Average Home Value in this Area
Purchase History
| Date | Buyer | Sale Price | Title Company |
|---|---|---|---|
| Sweeney Albert T | -- | -- | |
| Sweeney Matthew T | $9,500 | -- | |
| Sweeney Matthew T | $95,000 | -- |
Source: Public Records
Mortgage History
| Date | Status | Borrower | Loan Amount |
|---|---|---|---|
| Previous Owner | Sweeney Matthew T | $85,000 |
Source: Public Records
Tax History Compared to Growth
Tax History
| Year | Tax Paid | Tax Assessment Tax Assessment Total Assessment is a certain percentage of the fair market value that is determined by local assessors to be the total taxable value of land and additions on the property. | Land | Improvement |
|---|---|---|---|---|
| 2025 | $4,222 | $336,400 | $116,300 | $220,100 |
| 2024 | $4,094 | $321,600 | $116,300 | $205,300 |
| 2023 | $3,835 | $280,100 | $105,700 | $174,400 |
| 2022 | $3,630 | $251,200 | $100,700 | $150,500 |
| 2021 | $3,552 | $240,000 | $96,800 | $143,200 |
| 2020 | $3,394 | $233,100 | $94,000 | $139,100 |
| 2019 | $3,200 | $226,000 | $92,100 | $133,900 |
| 2018 | $3,047 | $205,600 | $89,500 | $116,100 |
| 2017 | $2,952 | $202,900 | $89,500 | $113,400 |
| 2016 | $2,874 | $193,900 | $87,800 | $106,100 |
| 2015 | $2,721 | $185,000 | $87,800 | $97,200 |
| 2014 | $2,655 | $178,800 | $83,600 | $95,200 |
Source: Public Records
Map
Nearby Homes
- 12 Tyson Place
- 44 Buffington St
- 23 Magnolia St Unit 2
- 52 Curtis Ave
- 980 Newport Ave
- 49 Gardner Ave
- 2 Gardner Ave
- 103 Hall Ave
- 39 Slade Ave
- 58 Baltic St Unit 58
- 56 Baltic St Unit 56
- 171 Mendon Rd
- 18 Newton St
- 50 Pullman Ave Unit A
- 50 Pullman Ave Unit B
- 48 Pullman Ave
- 330 Brown St
- 61 Mendon Rd
- 130 Zoar Ave
- 55 Leedham St Unit 2-6