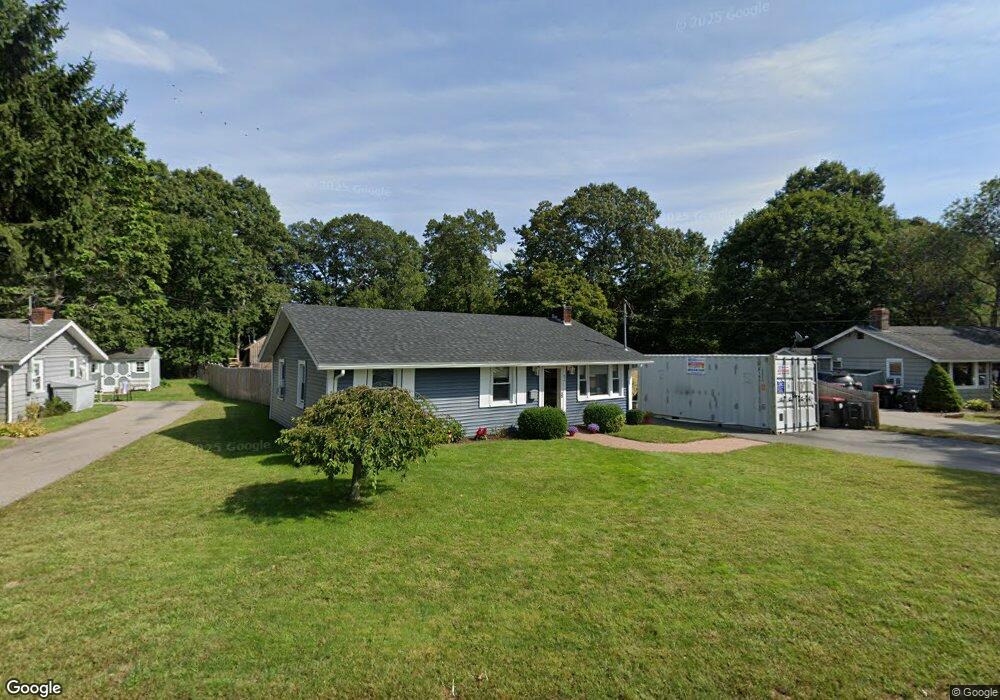
52 Concord St Brockton, MA 02302
Estimated Value: $466,000 - $556,000
3
Beds
2
Baths
1,504
Sq Ft
$341/Sq Ft
Est. Value
About This Home
This home is located at 52 Concord St, Brockton, MA 02302 and is currently estimated at $513,371, approximately $341 per square foot. 52 Concord St is a home located in Plymouth County with nearby schools including Davis K-8 School, John F. Kennedy Elementary School, and South Middle School.
Ownership History
Date
Name
Owned For
Owner Type
Purchase Details
Closed on
Nov 26, 2018
Sold by
Packard Valerie I
Bought by
Gazerro Frank A and Packard Valerie
Current Estimated Value
Home Financials for this Owner
Home Financials are based on the most recent Mortgage that was taken out on this home.
Original Mortgage
$153,000
Outstanding Balance
$97,719
Interest Rate
4.9%
Mortgage Type
New Conventional
Estimated Equity
$415,652
Purchase Details
Closed on
Sep 19, 1996
Sold by
Citicorp Mtg Inc
Bought by
Packard Valerie I
Purchase Details
Closed on
Dec 5, 1995
Sold by
Easton James E and Citicorp Mtg Inc
Bought by
Citicorp Mtg Inc
Create a Home Valuation Report for This Property
The Home Valuation Report is an in-depth analysis detailing your home's value as well as a comparison with similar homes in the area
Home Values in the Area
Average Home Value in this Area
Purchase History
| Date | Buyer | Sale Price | Title Company |
|---|---|---|---|
| Gazerro Frank A | -- | -- | |
| Packard Valerie I | $52,000 | -- | |
| Citicorp Mtg Inc | $47,000 | -- |
Source: Public Records
Mortgage History
| Date | Status | Borrower | Loan Amount |
|---|---|---|---|
| Open | Gazerro Frank A | $153,000 | |
| Previous Owner | Citicorp Mtg Inc | $159,000 | |
| Previous Owner | Citicorp Mtg Inc | $147,000 | |
| Previous Owner | Citicorp Mtg Inc | $85,500 |
Source: Public Records
Tax History Compared to Growth
Tax History
| Year | Tax Paid | Tax Assessment Tax Assessment Total Assessment is a certain percentage of the fair market value that is determined by local assessors to be the total taxable value of land and additions on the property. | Land | Improvement |
|---|---|---|---|---|
| 2025 | $5,186 | $428,200 | $167,600 | $260,600 |
| 2024 | $4,849 | $403,400 | $167,600 | $235,800 |
| 2023 | $4,331 | $333,700 | $118,500 | $215,200 |
| 2022 | $4,338 | $310,500 | $107,800 | $202,700 |
| 2021 | $3,951 | $272,500 | $100,300 | $172,200 |
| 2020 | $4,013 | $264,900 | $87,400 | $177,500 |
| 2019 | $3,615 | $232,600 | $83,900 | $148,700 |
| 2018 | $2,999 | $221,300 | $83,900 | $137,400 |
| 2017 | $2,999 | $186,300 | $83,900 | $102,400 |
| 2016 | $2,757 | $158,800 | $80,100 | $78,700 |
| 2015 | $2,719 | $149,800 | $80,100 | $69,700 |
| 2014 | $2,680 | $147,800 | $80,100 | $67,700 |
Source: Public Records
Map
Nearby Homes