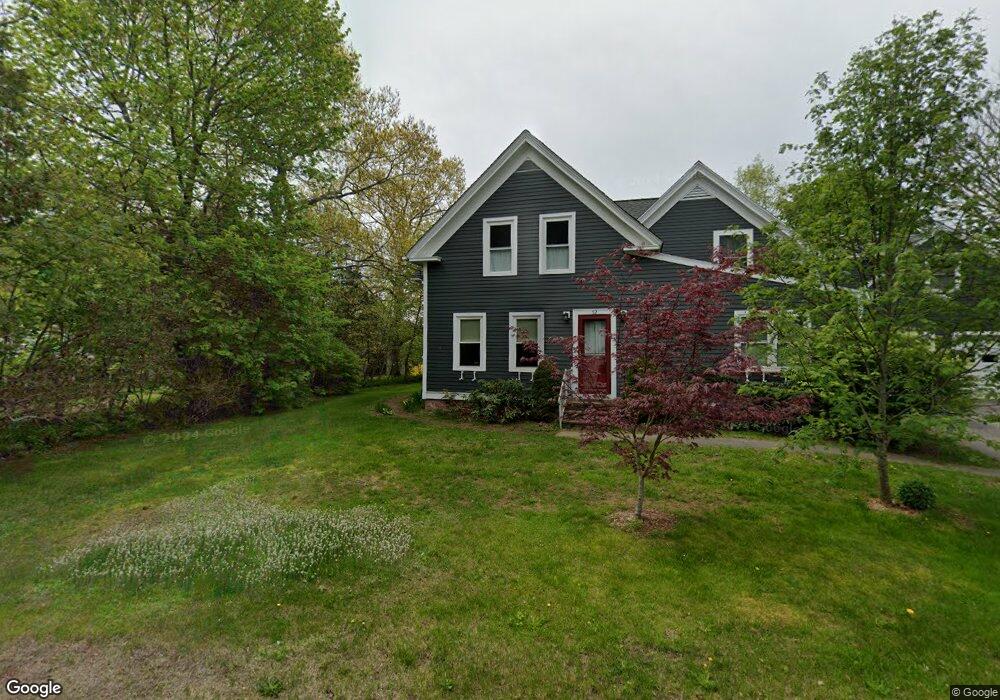
52 Conway Rd Camden, ME 04843
Estimated Value: $549,577 - $769,000
3
Beds
2
Baths
1,638
Sq Ft
$401/Sq Ft
Est. Value
About This Home
This home is located at 52 Conway Rd, Camden, ME 04843 and is currently estimated at $656,644, approximately $400 per square foot. 52 Conway Rd is a home located in Knox County with nearby schools including Camden-Rockport Elementary School, Camden-Rockport Middle School, and Camden Hills Regional High School.
Ownership History
Date
Name
Owned For
Owner Type
Purchase Details
Closed on
Jul 6, 2009
Sold by
Kesten Harry A and Kesten Maribeth
Bought by
Jalbuena Tracy and Cook James
Current Estimated Value
Purchase Details
Closed on
Oct 13, 2006
Sold by
Leavitt Henrietta Est
Bought by
Kesten Harry A and Kesten Maribeth
Home Financials for this Owner
Home Financials are based on the most recent Mortgage that was taken out on this home.
Original Mortgage
$196,800
Interest Rate
6.47%
Mortgage Type
Purchase Money Mortgage
Create a Home Valuation Report for This Property
The Home Valuation Report is an in-depth analysis detailing your home's value as well as a comparison with similar homes in the area
Home Values in the Area
Average Home Value in this Area
Purchase History
| Date | Buyer | Sale Price | Title Company |
|---|---|---|---|
| Jalbuena Tracy | -- | -- | |
| Kesten Harry A | -- | -- |
Source: Public Records
Mortgage History
| Date | Status | Borrower | Loan Amount |
|---|---|---|---|
| Previous Owner | Kesten Harry A | $196,800 |
Source: Public Records
Tax History Compared to Growth
Tax History
| Year | Tax Paid | Tax Assessment Tax Assessment Total Assessment is a certain percentage of the fair market value that is determined by local assessors to be the total taxable value of land and additions on the property. | Land | Improvement |
|---|---|---|---|---|
| 2024 | $5,820 | $408,400 | $66,300 | $342,100 |
| 2023 | $5,166 | $408,400 | $66,300 | $342,100 |
| 2022 | $28 | $288,700 | $55,000 | $233,700 |
| 2021 | $32 | $235,500 | $60,000 | $175,500 |
| 2020 | $32 | $235,500 | $60,000 | $175,500 |
| 2019 | $31 | $235,500 | $60,000 | $175,500 |
| 2018 | $30 | $235,500 | $60,000 | $175,500 |
| 2017 | $29 | $235,500 | $60,000 | $175,500 |
| 2016 | $37 | $235,500 | $60,000 | $175,500 |
| 2015 | $3,309 | $235,500 | $60,000 | $175,500 |
| 2014 | $2,646 | $203,700 | $58,000 | $145,700 |
| 2013 | $2,585 | $203,700 | $58,000 | $145,700 |
Source: Public Records
Map
Nearby Homes