Estimated Value: $392,000 - $428,303
5
Beds
2
Baths
2,272
Sq Ft
$181/Sq Ft
Est. Value
About This Home
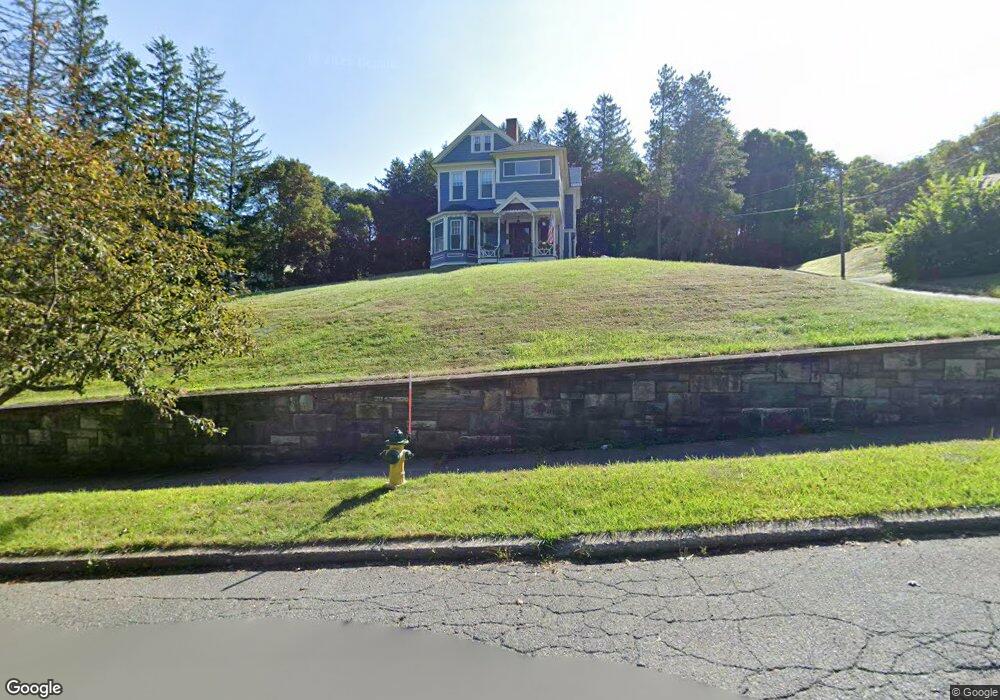
This home is located at 52 Crandall St, Adams, MA 01220 and is currently estimated at $411,326, approximately $181 per square foot. 52 Crandall St is a home located in Berkshire County with nearby schools including Hoosac Valley Middle & High School, Berkshire Arts & Technology Charter Public School, and St. Stanislaus Kostka School.
Ownership History
Date
Name
Owned For
Owner Type
Purchase Details
Closed on
Jul 7, 1994
Sold by
Adams Coop Bank
Bought by
Ludwig Michael A
Current Estimated Value
Purchase Details
Closed on
Jan 11, 1994
Sold by
Johansson Glen E and Adams Coop Bank
Bought by
Adams Coop Bank
Purchase Details
Closed on
Jun 30, 1987
Sold by
Kurtz Steven B
Bought by
Johansson Glenn E
Create a Home Valuation Report for This Property
The Home Valuation Report is an in-depth analysis detailing your home's value as well as a comparison with similar homes in the area
Home Values in the Area
Average Home Value in this Area
Purchase History
| Date | Buyer | Sale Price | Title Company |
|---|---|---|---|
| Ludwig Michael A | $118,000 | -- | |
| Adams Coop Bank | $120,000 | -- | |
| Johansson Glenn E | $176,000 | -- |
Source: Public Records
Mortgage History
| Date | Status | Borrower | Loan Amount |
|---|---|---|---|
| Open | Johansson Glenn E | $125,000 | |
| Closed | Johansson Glenn E | $40,000 | |
| Closed | Johansson Glenn E | $25,000 |
Source: Public Records
Tax History Compared to Growth
Tax History
| Year | Tax Paid | Tax Assessment Tax Assessment Total Assessment is a certain percentage of the fair market value that is determined by local assessors to be the total taxable value of land and additions on the property. | Land | Improvement |
|---|---|---|---|---|
| 2025 | $6,879 | $404,400 | $78,800 | $325,600 |
| 2024 | $6,479 | $369,400 | $74,100 | $295,300 |
| 2023 | $6,029 | $325,000 | $67,600 | $257,400 |
| 2022 | $5,887 | $281,800 | $58,800 | $223,000 |
| 2021 | $5,736 | $253,600 | $58,800 | $194,800 |
| 2020 | $5,520 | $252,300 | $58,800 | $193,500 |
| 2019 | $5,397 | $252,300 | $58,800 | $193,500 |
| 2018 | $5,524 | $248,700 | $58,800 | $189,900 |
| 2017 | $5,315 | $248,700 | $58,800 | $189,900 |
| 2016 | $5,146 | $240,600 | $58,800 | $181,800 |
| 2015 | $5,007 | $234,300 | $61,400 | $172,900 |
| 2014 | $4,674 | $234,300 | $61,400 | $172,900 |
Source: Public Records
Map
Nearby Homes
- 29 Crandall St
- 4 Edmunds St Unit A101
- 50 Commercial St
- 6 Crandall St
- 17 Morningside Ave
- 30 Summer St
- 46 E Orchard Terrace
- 10 Enterprise St
- 21 Enterprise St
- 21 Overlook Terrace
- 27 2nd St
- 71 Park St Unit 75
- 2 Melrose St
- 3 Melrose St
- 52 Alger St
- 9 Pinnacle Point
- 16-18 E Hoosac St
- 1 Godek St
- 128 E Hoosac St
- 0 E Hoosac St