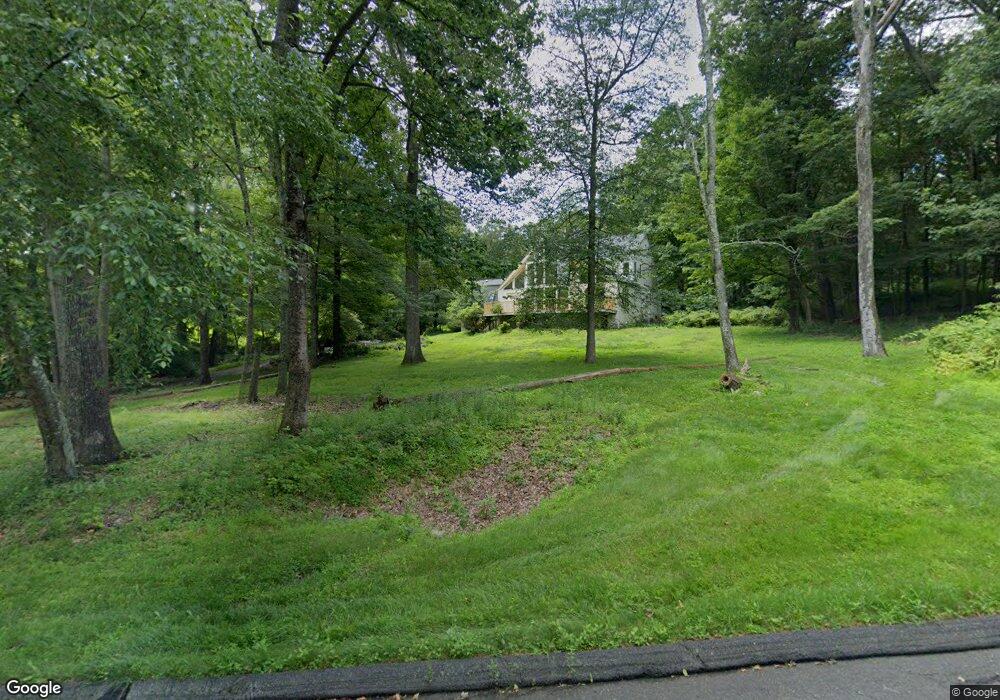
52 Deacon Abbott Rd Redding, CT 06896
Estimated Value: $971,690 - $1,114,000
4
Beds
4
Baths
3,001
Sq Ft
$345/Sq Ft
Est. Value
About This Home
This home is located at 52 Deacon Abbott Rd, Redding, CT 06896 and is currently estimated at $1,036,173, approximately $345 per square foot. 52 Deacon Abbott Rd is a home located in Fairfield County with nearby schools including Redding Elementary School, John Read Middle School, and Joel Barlow High School.
Ownership History
Date
Name
Owned For
Owner Type
Purchase Details
Closed on
Jun 25, 2013
Sold by
Acosta-Zawacki Nayade and Zawacki Edward W
Bought by
Zawacki Edward W
Current Estimated Value
Purchase Details
Closed on
Jan 25, 2012
Sold by
Zawacki Edward W
Bought by
Acosta-Zawacki Nayade and Zawacki Edward W
Purchase Details
Closed on
Oct 29, 2008
Sold by
Keegan Peggy
Bought by
Zawacki Edward
Home Financials for this Owner
Home Financials are based on the most recent Mortgage that was taken out on this home.
Original Mortgage
$412,700
Interest Rate
5.83%
Purchase Details
Closed on
Sep 1, 1999
Sold by
Horgan Christopher P
Bought by
Keegan Peggy
Purchase Details
Closed on
Nov 18, 1988
Sold by
Meyding George D
Bought by
Horgan Christopher P
Create a Home Valuation Report for This Property
The Home Valuation Report is an in-depth analysis detailing your home's value as well as a comparison with similar homes in the area
Home Values in the Area
Average Home Value in this Area
Purchase History
| Date | Buyer | Sale Price | Title Company |
|---|---|---|---|
| Zawacki Edward W | -- | -- | |
| Acosta-Zawacki Nayade | -- | -- | |
| Zawacki Edward | $635,000 | -- | |
| Keegan Peggy | $535,000 | -- | |
| Horgan Christopher P | $335,000 | -- |
Source: Public Records
Mortgage History
| Date | Status | Borrower | Loan Amount |
|---|---|---|---|
| Previous Owner | Horgan Christopher P | $412,700 | |
| Previous Owner | Horgan Christopher P | $572,000 |
Source: Public Records
Tax History
| Year | Tax Paid | Tax Assessment Tax Assessment Total Assessment is a certain percentage of the fair market value that is determined by local assessors to be the total taxable value of land and additions on the property. | Land | Improvement |
|---|---|---|---|---|
| 2025 | $14,179 | $480,000 | $154,500 | $325,500 |
| 2024 | $13,786 | $480,000 | $154,500 | $325,500 |
| 2023 | $13,291 | $480,000 | $154,500 | $325,500 |
| 2022 | $12,929 | $387,800 | $166,800 | $221,000 |
| 2021 | $12,735 | $387,800 | $166,800 | $221,000 |
| 2020 | $12,735 | $387,800 | $166,800 | $221,000 |
| 2019 | $9,988 | $387,800 | $166,800 | $221,000 |
| 2018 | $12,301 | $387,800 | $166,800 | $221,000 |
| 2017 | $12,251 | $413,600 | $182,400 | $231,200 |
| 2016 | $12,094 | $413,600 | $182,400 | $231,200 |
| 2015 | $11,957 | $413,600 | $182,400 | $231,200 |
| 2014 | $11,957 | $413,600 | $182,400 | $231,200 |
Source: Public Records
Map
Nearby Homes
- 2 Longwood Dr
- 45 Great Pasture Rd
- 241 Black Rock Turnpike
- 41 Deer Hill Rd
- 5 South Ln
- 7 Long Meadow Ln
- 24 Costa Ln
- 193 Chestnut Ridge Rd
- 36 Fox Run Rd
- 63 Turney Rd
- 138 Putnam Park Rd
- 98 Hopewell Woods Rd
- 229 Umpawaug Rd
- 299 Redding Rd
- 173 Chestnut Ridge Rd
- 22 Ledgewood Rd
- 41 Turkey Plain Rd
- 9 New Light Dr
- 4 Stone Dam Rd
- 9 Chuck Wagon Ln
- 46 Deacon Abbott Rd
- 15 Deacon Abbott Ln S
- 62 Deacon Abbott Rd
- 51 Deacon Abbott Rd
- 45 Deacon Abbott Rd
- 17 Deacon Abbott Ln S
- 9 Deacon Abbott Ln S
- 55 Deacon Abbott Rd
- 38 Deacon Abbott Rd
- 10 Deacon Abbott Ln S
- 47 Deacon Abbott Rd
- 41 Deacon Abbott Rd
- 59 Deacon Abbott Rd
- 49 Deacon Abbott Rd
- 57 Deacon Abbott Rd
- 63 Deacon Abbott Rd
- 65 Deacon Abbott Rd
- 6 Deacon Abbott Ln S
- 35 Deacon Abbott Rd
- 53 Deacon Abbott Rd
Your Personal Tour Guide
Ask me questions while you tour the home.