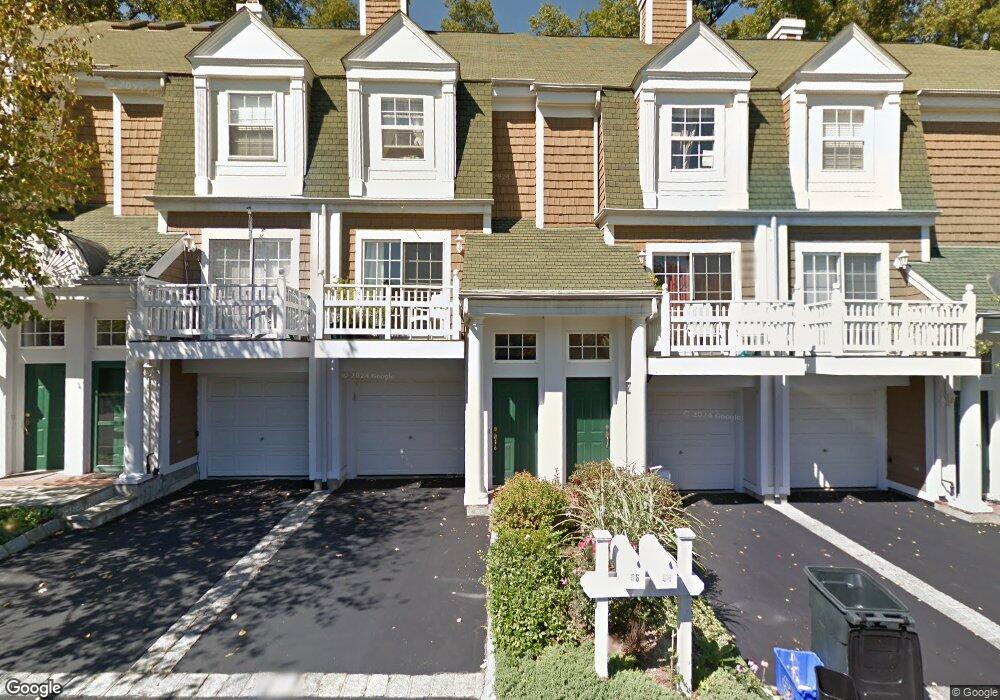
52 Deer Tree Ln Briarcliff Manor, NY 10510
Estimated Value: $701,481 - $782,000
2
Beds
2
Baths
1,857
Sq Ft
$395/Sq Ft
Est. Value
About This Home
This home is located at 52 Deer Tree Ln, Briarcliff Manor, NY 10510 and is currently estimated at $733,620, approximately $395 per square foot. 52 Deer Tree Ln is a home located in Westchester County with nearby schools including Todd Elementary School, Briarcliff Middle School, and Briarcliff High School.
Ownership History
Date
Name
Owned For
Owner Type
Purchase Details
Closed on
Aug 1, 2023
Sold by
Seigel Jeffrey S and Kierszenbaum-Seigel Adriana E
Bought by
Lin Shelley
Current Estimated Value
Home Financials for this Owner
Home Financials are based on the most recent Mortgage that was taken out on this home.
Original Mortgage
$310,000
Outstanding Balance
$302,750
Interest Rate
6.67%
Mortgage Type
New Conventional
Estimated Equity
$430,870
Purchase Details
Closed on
Aug 19, 2002
Sold by
Stark Jonathon P and Stark Sherry
Bought by
Seigel Jeffrey S and Kierszenbaum Seigel Adriana E
Home Financials for this Owner
Home Financials are based on the most recent Mortgage that was taken out on this home.
Original Mortgage
$364,000
Interest Rate
5.62%
Mortgage Type
Commercial
Purchase Details
Closed on
Aug 8, 2000
Sold by
Finch Margaret L
Bought by
Stark Jonathan P and Stark Sherry
Create a Home Valuation Report for This Property
The Home Valuation Report is an in-depth analysis detailing your home's value as well as a comparison with similar homes in the area
Home Values in the Area
Average Home Value in this Area
Purchase History
| Date | Buyer | Sale Price | Title Company |
|---|---|---|---|
| Lin Shelley | $620,000 | Thoroughbred Title | |
| Seigel Jeffrey S | $455,000 | -- | |
| Stark Jonathan P | $375,000 | Commonwealth Land Title Ins |
Source: Public Records
Mortgage History
| Date | Status | Borrower | Loan Amount |
|---|---|---|---|
| Open | Lin Shelley | $310,000 | |
| Previous Owner | Seigel Jeffrey S | $364,000 |
Source: Public Records
Tax History Compared to Growth
Tax History
| Year | Tax Paid | Tax Assessment Tax Assessment Total Assessment is a certain percentage of the fair market value that is determined by local assessors to be the total taxable value of land and additions on the property. | Land | Improvement |
|---|---|---|---|---|
| 2024 | $9,135 | $322,800 | $85,800 | $237,000 |
| 2023 | $9,019 | $313,000 | $85,800 | $227,200 |
| 2022 | $8,637 | $288,200 | $85,800 | $202,400 |
| 2021 | $8,743 | $277,900 | $85,800 | $192,100 |
| 2020 | $8,396 | $268,500 | $85,800 | $182,700 |
| 2019 | $8,416 | $263,000 | $85,800 | $177,200 |
| 2018 | $6,633 | $263,000 | $85,800 | $177,200 |
| 2017 | $1,263 | $251,700 | $85,800 | $165,900 |
| 2016 | $66,084 | $251,700 | $85,800 | $165,900 |
| 2015 | $7,722 | $14,097 | $7,200 | $6,897 |
| 2014 | $7,722 | $14,097 | $7,200 | $6,897 |
| 2013 | $7,722 | $14,097 | $7,200 | $6,897 |
Source: Public Records
Map
Nearby Homes
- 333 N State Rd Unit 55
- 175 Chappaqua Rd
- 7 Dunn Ln
- 517 Old Chappaqua Rd
- 48 Ganung Dr
- 37 Tulip Rd
- 6 Leawood Dr
- 19 Donald Ln
- 110 Morningside Dr
- 120 Morningside Dr
- 858 Pleasantville Rd
- 10 Shadow Tree Ln
- 10 Mohegan Rd
- 134 Dalmeny Rd
- 177 Old Briarcliff Rd
- 409 Central Dr
- 345 Elm Rd
- 94 Somerstown Rd
- 59 Somerstown Rd
- 33 Ryder Rd
- 52 Deertree Ln
- 50 Deer Tree Ln
- 25 Deertree Ln
- 25 Deer Tree Ln
- 29 Winterberry Ln
- 3 Deer Tree Ln
- 26 Winterberry Ln
- 19 Deer Tree Ln Unit 19
- 25 Winterberry Ln
- 1 Deertree Ln
- 25 Winterberry Ln Unit 25
- 42 Deer Tree Ln
- 42 Deertree Ln
- 35 Deer Tree Ln
- 35 Deer Tree Ln Unit 35
- 40 Deer Tree Ln
- 37 Deertree Ln
- 37 Deer Tree Ln
- 38 Deertree Ln Unit 38
- 38 Deer Tree Ln