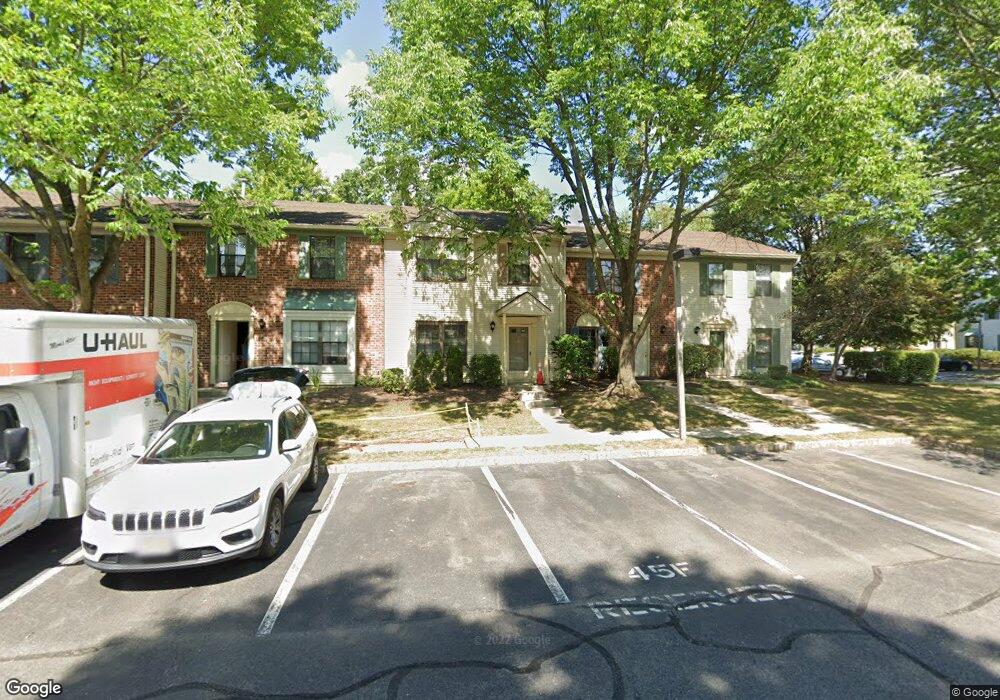
52 Drewes Ct Lawrence Township, NJ 08648
Estimated Value: $374,000 - $446,000
2
Beds
3
Baths
1,700
Sq Ft
$239/Sq Ft
Est. Value
About This Home
This home is located at 52 Drewes Ct, Lawrence Township, NJ 08648 and is currently estimated at $405,804, approximately $238 per square foot. 52 Drewes Ct is a home located in Mercer County with nearby schools including Lawrence High School and Chapin School Princeton.
Ownership History
Date
Name
Owned For
Owner Type
Purchase Details
Closed on
Sep 23, 2011
Sold by
Chiu Robert Sing and Du Phung
Bought by
Arshad Syed Asif and Jaleel Ayesha
Current Estimated Value
Home Financials for this Owner
Home Financials are based on the most recent Mortgage that was taken out on this home.
Original Mortgage
$189,900
Outstanding Balance
$129,669
Interest Rate
4.2%
Mortgage Type
New Conventional
Estimated Equity
$276,135
Purchase Details
Closed on
Aug 15, 1997
Sold by
Brenner James
Bought by
Roberg Sing Chiu and Du Phung
Create a Home Valuation Report for This Property
The Home Valuation Report is an in-depth analysis detailing your home's value as well as a comparison with similar homes in the area
Home Values in the Area
Average Home Value in this Area
Purchase History
| Date | Buyer | Sale Price | Title Company |
|---|---|---|---|
| Arshad Syed Asif | $211,000 | Sterling Title Agency | |
| Roberg Sing Chiu | $103,500 | -- |
Source: Public Records
Mortgage History
| Date | Status | Borrower | Loan Amount |
|---|---|---|---|
| Open | Arshad Syed Asif | $189,900 |
Source: Public Records
Tax History Compared to Growth
Tax History
| Year | Tax Paid | Tax Assessment Tax Assessment Total Assessment is a certain percentage of the fair market value that is determined by local assessors to be the total taxable value of land and additions on the property. | Land | Improvement |
|---|---|---|---|---|
| 2025 | $6,196 | $200,000 | $50,000 | $150,000 |
| 2024 | $6,072 | $200,000 | $50,000 | $150,000 |
| 2023 | $6,072 | $200,000 | $50,000 | $150,000 |
| 2022 | $5,962 | $200,000 | $50,000 | $150,000 |
| 2021 | $5,886 | $200,000 | $50,000 | $150,000 |
| 2020 | $5,804 | $200,000 | $50,000 | $150,000 |
| 2019 | $5,730 | $200,000 | $50,000 | $150,000 |
| 2018 | $5,600 | $200,000 | $50,000 | $150,000 |
| 2017 | $5,574 | $200,000 | $50,000 | $150,000 |
| 2016 | $5,492 | $200,000 | $50,000 | $150,000 |
| 2015 | $5,340 | $200,000 | $50,000 | $150,000 |
| 2014 | $5,240 | $200,000 | $50,000 | $150,000 |
Source: Public Records
Map
Nearby Homes