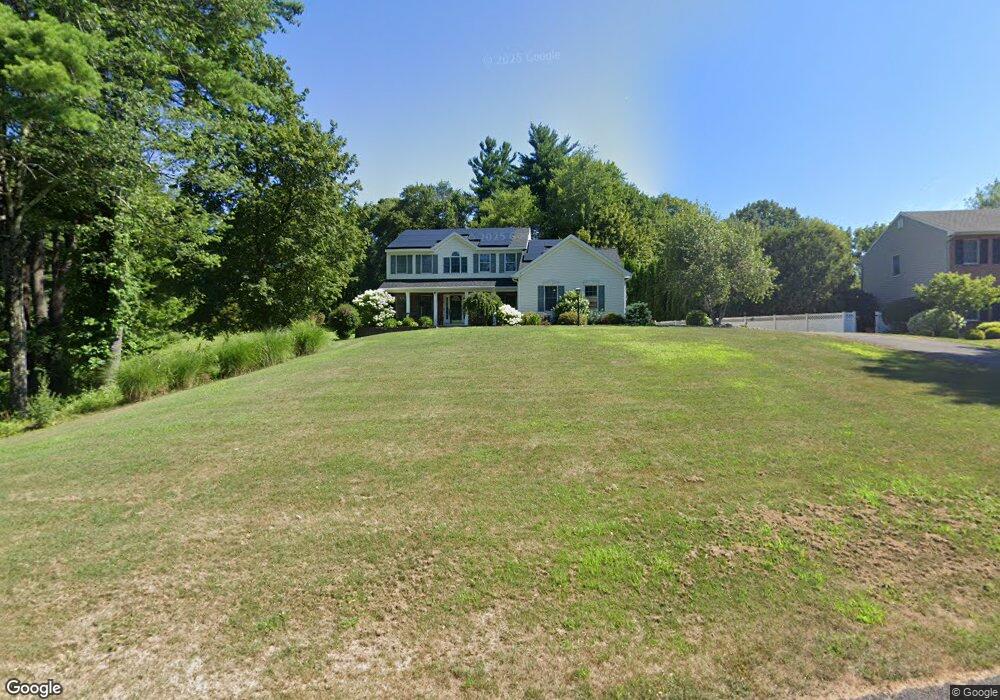
52 Duncan Phyfe Ln Slingerlands, NY 12159
Estimated Value: $585,000 - $742,000
4
Beds
3
Baths
2,315
Sq Ft
$279/Sq Ft
Est. Value
About This Home
This home is located at 52 Duncan Phyfe Ln, Slingerlands, NY 12159 and is currently estimated at $645,132, approximately $278 per square foot. 52 Duncan Phyfe Ln is a home located in Albany County with nearby schools including St. Thomas the Apostle School and Academy of the Holy Names.
Ownership History
Date
Name
Owned For
Owner Type
Purchase Details
Closed on
Jul 22, 2015
Sold by
Guidara Rose F
Bought by
Gould Walter
Current Estimated Value
Home Financials for this Owner
Home Financials are based on the most recent Mortgage that was taken out on this home.
Original Mortgage
$315,000
Outstanding Balance
$115,590
Interest Rate
3.03%
Mortgage Type
New Conventional
Estimated Equity
$529,542
Purchase Details
Closed on
Jun 23, 2015
Sold by
Gould Walter A and Gould Sarah J
Bought by
Vogel Sarah
Home Financials for this Owner
Home Financials are based on the most recent Mortgage that was taken out on this home.
Original Mortgage
$315,000
Outstanding Balance
$115,590
Interest Rate
3.03%
Mortgage Type
New Conventional
Estimated Equity
$529,542
Purchase Details
Closed on
Oct 4, 2000
Sold by
Charlew Construction Co., Inc.
Bought by
Gould Walter A
Create a Home Valuation Report for This Property
The Home Valuation Report is an in-depth analysis detailing your home's value as well as a comparison with similar homes in the area
Home Values in the Area
Average Home Value in this Area
Purchase History
| Date | Buyer | Sale Price | Title Company |
|---|---|---|---|
| Gould Walter | $185,000 | None Available | |
| Vogel Sarah | -- | None Available | |
| Gould Walter A | $266,312 | Gouhd Bbertrand F |
Source: Public Records
Mortgage History
| Date | Status | Borrower | Loan Amount |
|---|---|---|---|
| Open | Vogel Sarah | $315,000 |
Source: Public Records
Tax History Compared to Growth
Tax History
| Year | Tax Paid | Tax Assessment Tax Assessment Total Assessment is a certain percentage of the fair market value that is determined by local assessors to be the total taxable value of land and additions on the property. | Land | Improvement |
|---|---|---|---|---|
| 2024 | $13,089 | $392,500 | $107,000 | $285,500 |
| 2023 | $12,741 | $392,500 | $107,000 | $285,500 |
| 2022 | $11,819 | $392,500 | $107,000 | $285,500 |
| 2021 | $11,892 | $392,500 | $107,000 | $285,500 |
| 2020 | $11,818 | $392,500 | $107,000 | $285,500 |
| 2019 | $10,684 | $392,500 | $107,000 | $285,500 |
| 2018 | $11,580 | $392,500 | $107,000 | $285,500 |
| 2017 | $11,292 | $392,500 | $107,000 | $285,500 |
| 2016 | $11,292 | $392,500 | $107,000 | $285,500 |
| 2015 | -- | $392,500 | $107,000 | $285,500 |
| 2014 | -- | $392,500 | $107,000 | $285,500 |
Source: Public Records
Map
Nearby Homes
- 114 North St
- 7 Merrifield Place
- 77 Mccormack Rd
- 26 Mohican Place
- 484 Kenwood Ave
- 41 Mountainview Ave
- 616 Kenwood Ave
- 618 Kenwood Ave
- 19 Orchard St
- 51 Wood Terrace
- 8 Quadrini Dr
- 3 Grove St
- 431 Delaware Ave
- 1200 New Scotland Rd
- 26 Fairway Ct
- 17 Morningside Dr
- 5 Morningside Dr
- 15 Roweland Ave
- 9 Groesbeck Place
- 91 Orchard St
- 56 Duncan Phyfe Ln
- 60 Duncan Phyfe Ln
- 57 Duncan Phyfe La
- 57 Duncan Phyfe Ln
- 64 Duncan Phyfe Ln
- 19 Queen Anne Dr
- 68 Duncan Phyfe Ln
- 38 Duncan Phyfe Ln
- 25 Queen Anne Dr
- 30 Duncan Phyfe Ln
- 22 Queen Anne Dr
- 27 Duncan Phyfe Ln
- 27 Duncan Phyfe Ln
- 31 Queen Anne Dr
- 72 Duncan Phyfe Ln
- 28 Queen Anne Dr
- 21 Duncan Phyfe Ln
- 79 Duncan Phyfe Ln
- 77 Duncan Phyfe Ln
- 22 Duncan Phyfe Ln