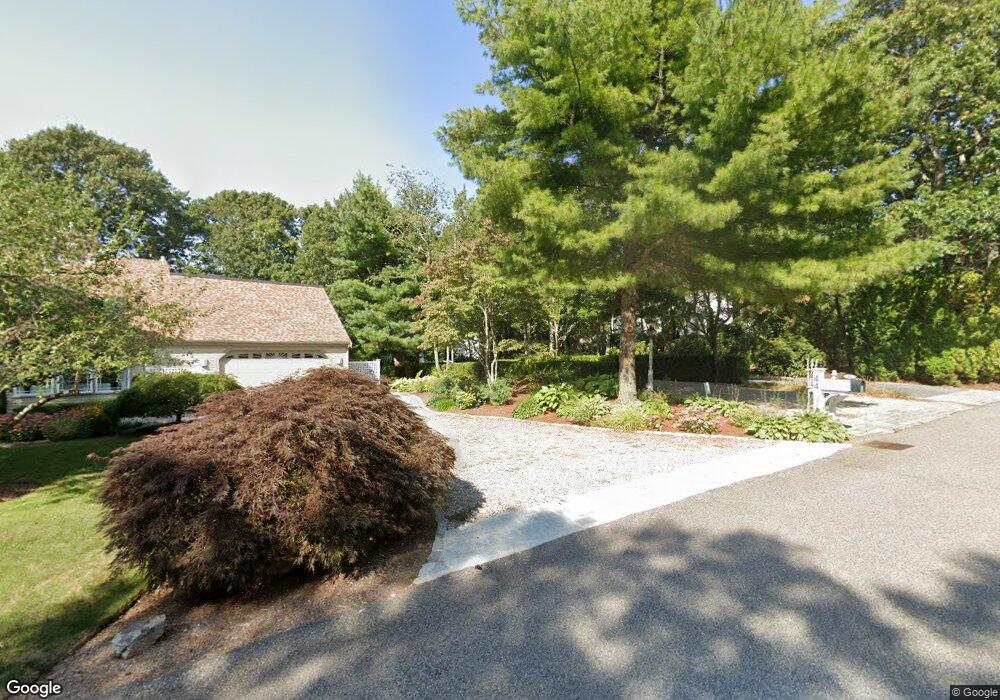
52 Fox Run Centerville, MA 02632
Centerville NeighborhoodEstimated Value: $899,000 - $1,458,000
4
Beds
3
Baths
1,801
Sq Ft
$594/Sq Ft
Est. Value
About This Home
This home is located at 52 Fox Run, Centerville, MA 02632 and is currently estimated at $1,069,268, approximately $593 per square foot. 52 Fox Run is a home located in Barnstable County with nearby schools including Centerville Elementary School, Barnstable United Elementary School, and Barnstable Intermediate School.
Ownership History
Date
Name
Owned For
Owner Type
Purchase Details
Closed on
Aug 4, 2014
Sold by
Schulte Robert A and Schulte Anne O
Bought by
Anne Oneill Schulte T
Current Estimated Value
Purchase Details
Closed on
Mar 27, 1996
Sold by
Lanzbom Leon E and Lanzbom Arlene R
Bought by
Schulte Robert A
Purchase Details
Closed on
Oct 26, 1989
Sold by
Jehling Russell
Bought by
Lanzbom Leon E
Create a Home Valuation Report for This Property
The Home Valuation Report is an in-depth analysis detailing your home's value as well as a comparison with similar homes in the area
Home Values in the Area
Average Home Value in this Area
Purchase History
| Date | Buyer | Sale Price | Title Company |
|---|---|---|---|
| Anne Oneill Schulte T | -- | -- | |
| Schulte Robert A | $216,000 | -- | |
| Lanzbom Leon E | $200,000 | -- |
Source: Public Records
Mortgage History
| Date | Status | Borrower | Loan Amount |
|---|---|---|---|
| Previous Owner | Lanzbom Leon E | $255,000 | |
| Previous Owner | Lanzbom Leon E | $209,000 | |
| Previous Owner | Lanzbom Leon E | $200,000 |
Source: Public Records
Tax History
| Year | Tax Paid | Tax Assessment Tax Assessment Total Assessment is a certain percentage of the fair market value that is determined by local assessors to be the total taxable value of land and additions on the property. | Land | Improvement |
|---|---|---|---|---|
| 2025 | $6,781 | $838,200 | $278,300 | $559,900 |
| 2024 | $6,339 | $811,600 | $278,300 | $533,300 |
| 2023 | $6,174 | $740,300 | $275,300 | $465,000 |
| 2022 | $5,424 | $562,700 | $176,400 | $386,300 |
| 2021 | $5,675 | $541,000 | $187,400 | $353,600 |
| 2020 | $5,625 | $513,200 | $198,400 | $314,800 |
| 2019 | $5,971 | $529,300 | $209,400 | $319,900 |
| 2018 | $5,501 | $490,300 | $208,900 | $281,400 |
| 2017 | $5,270 | $489,800 | $214,700 | $275,100 |
| 2016 | $5,307 | $486,900 | $211,800 | $275,100 |
| 2015 | $5,297 | $488,200 | $212,600 | $275,600 |
Source: Public Records
Map
Nearby Homes
- 443 Elliott Rd
- 290 Riverview Ln
- 498 Elliott Rd
- 33 Edgewood Rd
- 780 Craigville Beach Rd Unit D-2
- 780 Craigville Beach Rd Unit 1
- 780 Craigville Beach Rd
- 156 S Main St
- 260 Tobey Way
- 576 Strawberry Hill Rd
- 1060 Craigville Beach Rd
- 855 W Main St Unit 7
- 40 Sachem Dr
- 83 Peacock Dr
- 140 6th Ave
- 36 Grouse Ln
- 20 Sunset Terrace
- 10 Sail a Way
- 10 Sail -A-way
- 103 Pine Tree Dr
Your Personal Tour Guide
Ask me questions while you tour the home.