Estimated Value: $545,000 - $600,000
3
Beds
3
Baths
1,664
Sq Ft
$343/Sq Ft
Est. Value
About This Home
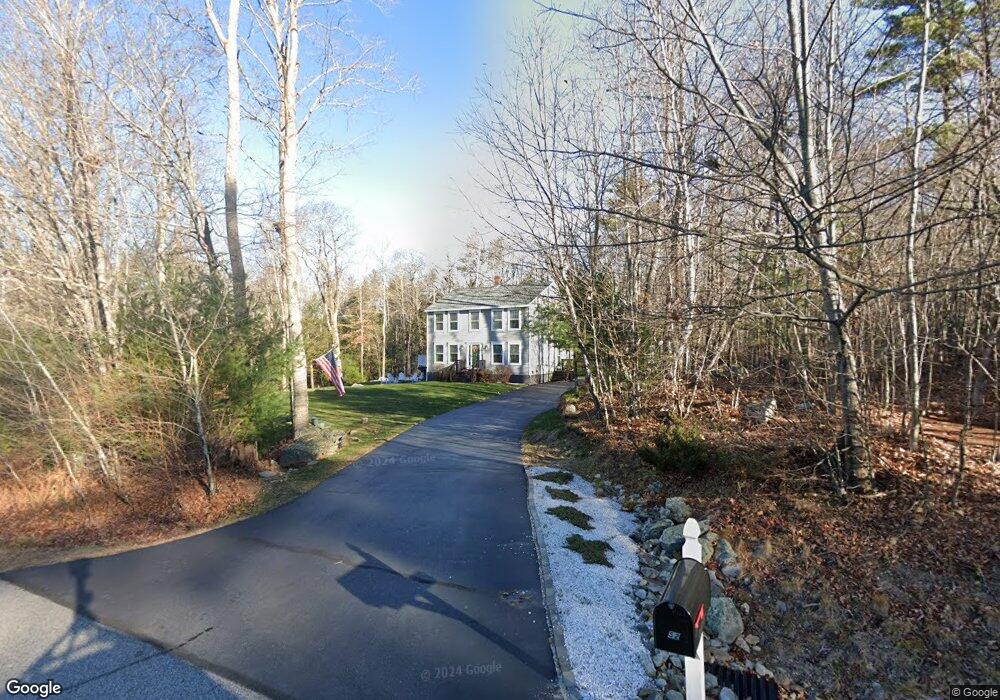
This home is located at 52 Fox Run Rd, Gray, ME 04039 and is currently estimated at $571,298, approximately $343 per square foot. 52 Fox Run Rd is a home with nearby schools including Gray-New Gloucester High School.
Ownership History
Date
Name
Owned For
Owner Type
Purchase Details
Closed on
Mar 2, 2010
Sold by
Chase Custom Homes
Bought by
Bilodeau Chad W and Bilodeau Kathie B
Current Estimated Value
Home Financials for this Owner
Home Financials are based on the most recent Mortgage that was taken out on this home.
Original Mortgage
$212,087
Outstanding Balance
$143,080
Interest Rate
5.5%
Mortgage Type
FHA
Estimated Equity
$428,218
Purchase Details
Closed on
Aug 27, 2009
Sold by
Kto Builders Inc
Bought by
Chase Custom Homes & Fin
Create a Home Valuation Report for This Property
The Home Valuation Report is an in-depth analysis detailing your home's value as well as a comparison with similar homes in the area
Home Values in the Area
Average Home Value in this Area
Purchase History
| Date | Buyer | Sale Price | Title Company |
|---|---|---|---|
| Bilodeau Chad W | -- | -- | |
| Chase Custom Homes & Fin | -- | -- |
Source: Public Records
Mortgage History
| Date | Status | Borrower | Loan Amount |
|---|---|---|---|
| Open | Chase Custom Homes & Fin | $212,087 |
Source: Public Records
Tax History
| Year | Tax Paid | Tax Assessment Tax Assessment Total Assessment is a certain percentage of the fair market value that is determined by local assessors to be the total taxable value of land and additions on the property. | Land | Improvement |
|---|---|---|---|---|
| 2025 | $5,158 | $532,900 | $138,500 | $394,400 |
| 2024 | $5,169 | $532,900 | $138,500 | $394,400 |
| 2023 | $4,795 | $315,900 | $80,000 | $235,900 |
| 2022 | $4,407 | $315,900 | $80,000 | $235,900 |
| 2021 | $4,107 | $281,100 | $80,000 | $201,100 |
| 2020 | $4,146 | $281,100 | $80,000 | $201,100 |
| 2019 | $4,146 | $281,100 | $80,000 | $201,100 |
| 2018 | $3,935 | $281,100 | $80,000 | $201,100 |
| 2017 | $3,969 | $219,900 | $63,400 | $156,500 |
| 2016 | $4,004 | $218,800 | $63,400 | $155,400 |
| 2015 | $3,982 | $218,800 | $63,400 | $155,400 |
| 2014 | $3,982 | $218,800 | $63,400 | $155,400 |
| 2012 | $3,386 | $213,605 | $63,381 | $150,224 |
Source: Public Records
Map
Nearby Homes
- 11 Dragonfly Dr
- 1,8 Sugar Maple Rd
- 14 Yarmouth Rd
- 13 Yarmouth Rd
- 25 Yarmouth Rd
- 66 James Way
- 22 Gray Park
- 60 Woodcock Dr
- 19 Woodcock Dr
- 22 Woodcock Dr
- 15 Woodcock Dr
- 14 Woodcock Dr
- 30 Motorcycle Dr
- 0 Colley Hill Rd
- 22 Old Rd
- 17 Callaway Dr Unit 17
- 52 Colley Hill Rd
- 7 Baxter Woods Trail
- 42 Wild Acres Rd
- 38 Blackthorne Ln
Your Personal Tour Guide
Ask me questions while you tour the home.