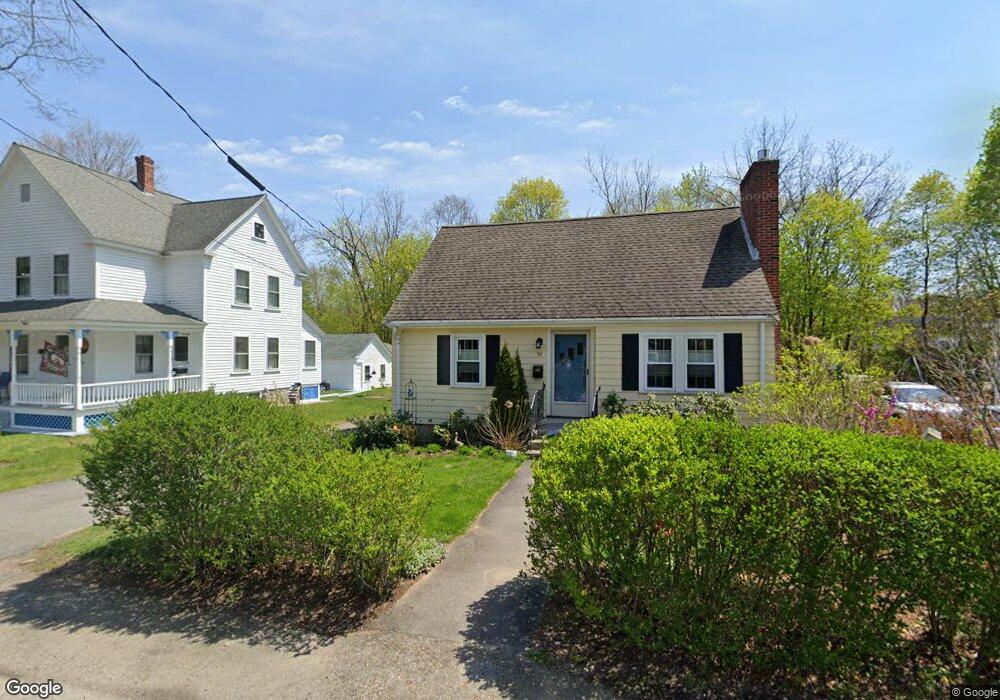
52 Glendale St Maynard, MA 01754
Estimated Value: $527,000 - $569,782
2
Beds
2
Baths
1,323
Sq Ft
$417/Sq Ft
Est. Value
About This Home
This home is located at 52 Glendale St, Maynard, MA 01754 and is currently estimated at $551,946, approximately $417 per square foot. 52 Glendale St is a home located in Middlesex County with nearby schools including Green Meadow School, Fowler School, and Maynard High School.
Ownership History
Date
Name
Owned For
Owner Type
Purchase Details
Closed on
Oct 21, 2021
Sold by
Jones Tresa R and Jones Norman C
Bought by
Norman & Tresa Jones Lt
Current Estimated Value
Purchase Details
Closed on
Jul 16, 2013
Sold by
Goguen Joseph D and Goguen Jennifer L
Bought by
Jones Tresa R and Jones Norman C
Purchase Details
Closed on
Apr 30, 2013
Sold by
T D
Bought by
Goguen Joseph D and Goguen Jennifer L
Purchase Details
Closed on
Sep 7, 2000
Sold by
Brooks Cynthia
Bought by
Dee Paul V and Mangan Lorraine H
Create a Home Valuation Report for This Property
The Home Valuation Report is an in-depth analysis detailing your home's value as well as a comparison with similar homes in the area
Home Values in the Area
Average Home Value in this Area
Purchase History
| Date | Buyer | Sale Price | Title Company |
|---|---|---|---|
| Norman & Tresa Jones Lt | -- | None Available | |
| Jones Tresa R | $264,700 | -- | |
| Goguen Joseph D | $155,000 | -- | |
| Dee Paul V | $20,000 | -- |
Source: Public Records
Tax History
| Year | Tax Paid | Tax Assessment Tax Assessment Total Assessment is a certain percentage of the fair market value that is determined by local assessors to be the total taxable value of land and additions on the property. | Land | Improvement |
|---|---|---|---|---|
| 2025 | $8,598 | $482,200 | $251,300 | $230,900 |
| 2024 | $7,937 | $443,900 | $239,200 | $204,700 |
| 2023 | $7,728 | $407,400 | $224,600 | $182,800 |
| 2022 | $7,572 | $369,000 | $195,300 | $173,700 |
| 2021 | $7,159 | $355,300 | $190,400 | $164,900 |
| 2020 | $7,236 | $350,600 | $185,500 | $165,100 |
| 2019 | $6,863 | $326,200 | $163,600 | $162,600 |
| 2018 | $6,473 | $285,900 | $143,500 | $142,400 |
| 2017 | $6,293 | $285,900 | $143,500 | $142,400 |
| 2016 | $5,912 | $278,200 | $143,500 | $134,700 |
| 2015 | $5,723 | $256,500 | $140,600 | $115,900 |
| 2014 | $5,488 | $246,200 | $134,300 | $111,900 |
Source: Public Records
Map
Nearby Homes
- 66 Powder Mill Rd
- 68 Powder Mill Rd
- 12 Brown St
- 70 Powder Mill Rd
- 28 Waltham St Unit A
- 22 Douglas Ave Unit 2
- 22 Douglas Ave Unit 1
- 36 Brown St
- 5 Hayes St Unit 5
- 13 Arthur St Unit 15
- 23 Deer Path Unit 5
- 24 Deer Path Unit 5
- 31-33 Roosevelt St
- 63 Conant St
- 10 Mill St Unit B
- 153 Summer St
- 41 Taylor Rd
- 96 Forest Ridge Rd Unit 96
- 1 Drummer Rd Unit A5
- 128 Parker St Unit 3B
Your Personal Tour Guide
Ask me questions while you tour the home.