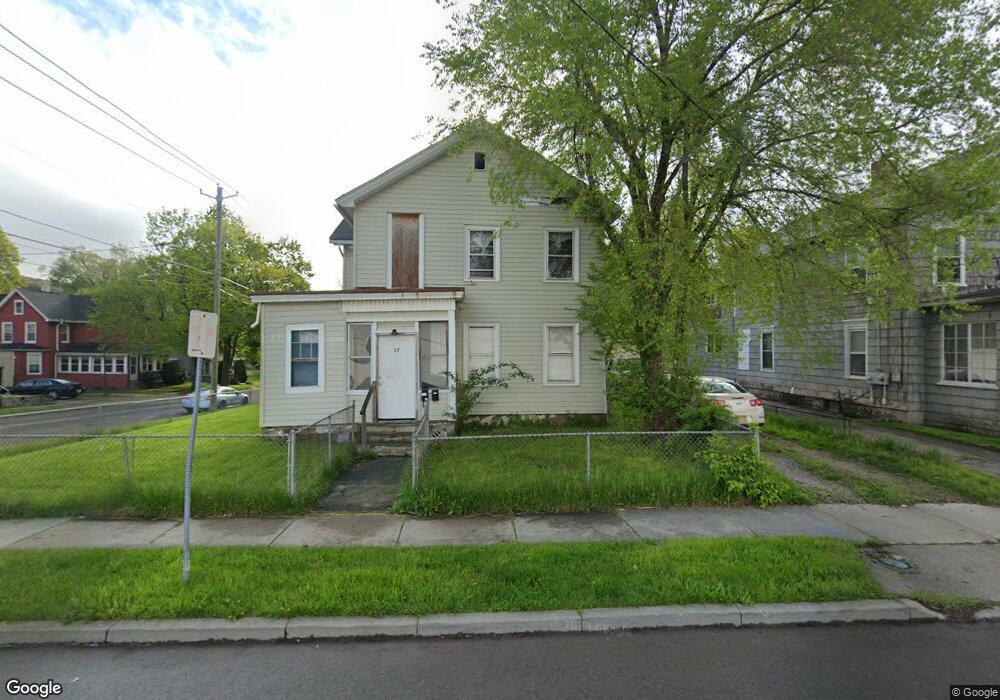
52 Griswold St Binghamton, NY 13904
Eastside Binghamton NeighborhoodEstimated Value: $102,000 - $168,000
4
Beds
2
Baths
2,094
Sq Ft
$65/Sq Ft
Est. Value
About This Home
This home is located at 52 Griswold St, Binghamton, NY 13904 and is currently estimated at $135,476, approximately $64 per square foot. 52 Griswold St is a home located in Broome County with nearby schools including Calvin Coolidge Elementary School, Binghamton High School, and East Middle School.
Ownership History
Date
Name
Owned For
Owner Type
Purchase Details
Closed on
May 11, 2015
Sold by
Mastronardi Michael
Bought by
52 Griswold Llc
Current Estimated Value
Purchase Details
Closed on
Jul 12, 2011
Sold by
The County Of Broome
Bought by
Mastronardi Michael
Purchase Details
Closed on
Feb 4, 2011
Sold by
Keough Kevin P
Bought by
County Of Broome
Purchase Details
Closed on
Jul 12, 2006
Sold by
Nissen Svend
Bought by
Srikishun Savitree
Create a Home Valuation Report for This Property
The Home Valuation Report is an in-depth analysis detailing your home's value as well as a comparison with similar homes in the area
Home Values in the Area
Average Home Value in this Area
Purchase History
| Date | Buyer | Sale Price | Title Company |
|---|---|---|---|
| 52 Griswold Llc | -- | David Berger | |
| 52 Griswold Llc | -- | None Available | |
| Mastronardi Michael | $48,000 | None Available | |
| County Of Broome | -- | None Available | |
| Srikishun Savitree | $26,000 | Robert Madigan |
Source: Public Records
Tax History Compared to Growth
Tax History
| Year | Tax Paid | Tax Assessment Tax Assessment Total Assessment is a certain percentage of the fair market value that is determined by local assessors to be the total taxable value of land and additions on the property. | Land | Improvement |
|---|---|---|---|---|
| 2024 | $3,449 | $35,000 | $6,500 | $28,500 |
| 2023 | $3,387 | $35,000 | $6,500 | $28,500 |
| 2022 | $3,307 | $35,000 | $6,500 | $28,500 |
| 2021 | $3,270 | $35,000 | $6,500 | $28,500 |
| 2020 | $2,162 | $35,000 | $6,500 | $28,500 |
| 2019 | $1,104 | $35,000 | $6,500 | $28,500 |
| 2018 | $2,108 | $35,000 | $6,500 | $28,500 |
| 2017 | $2,412 | $35,000 | $6,500 | $28,500 |
| 2016 | $2,278 | $35,000 | $6,500 | $28,500 |
| 2015 | $1,890 | $35,000 | $6,500 | $28,500 |
| 2014 | $1,890 | $29,000 | $6,500 | $22,500 |
Source: Public Records
Map
Nearby Homes