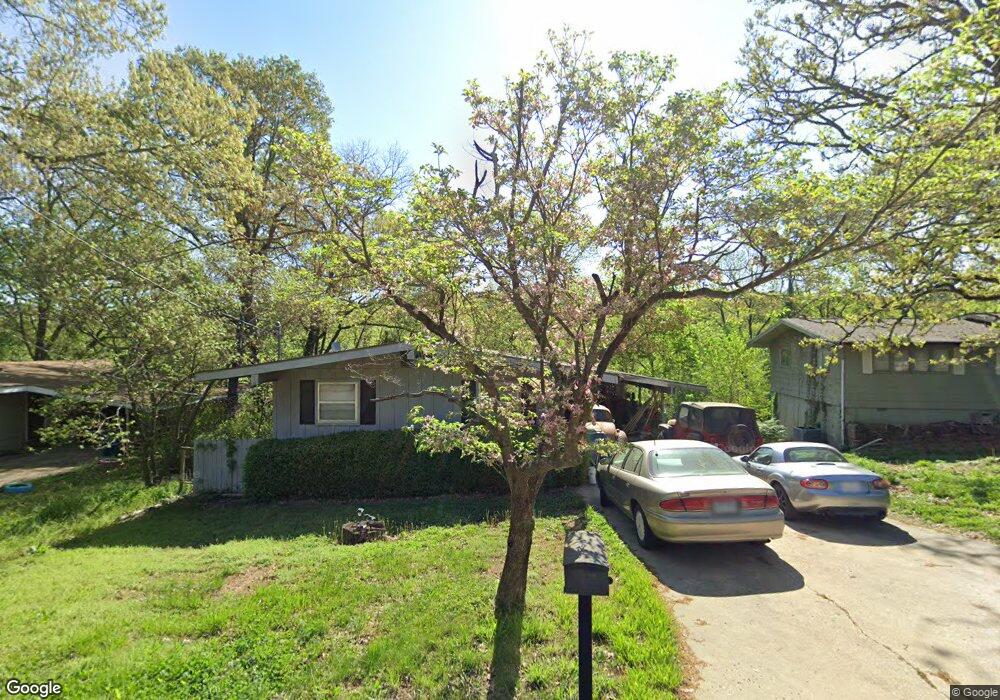
52 Hatcher Dr Bella Vista, AR 72715
Estimated Value: $227,000 - $235,000
3
Beds
2
Baths
1,144
Sq Ft
$202/Sq Ft
Est. Value
About This Home
This home is located at 52 Hatcher Dr, Bella Vista, AR 72715 and is currently estimated at $231,327, approximately $202 per square foot. 52 Hatcher Dr is a home located in Benton County with nearby schools including Cooper Elementary School, Old High Middle School, and Washington Junior High School.
Ownership History
Date
Name
Owned For
Owner Type
Purchase Details
Closed on
Jan 19, 2005
Sold by
Scott John R and Scott Ellen Jo
Bought by
Wohlford Rentals Inc
Current Estimated Value
Home Financials for this Owner
Home Financials are based on the most recent Mortgage that was taken out on this home.
Original Mortgage
$77,638
Interest Rate
5.8%
Mortgage Type
Unknown
Purchase Details
Closed on
Sep 18, 2000
Bought by
Scott Tr/Scott Tr
Purchase Details
Closed on
Nov 14, 1994
Bought by
Scott
Purchase Details
Closed on
Dec 23, 1980
Bought by
Sharp
Create a Home Valuation Report for This Property
The Home Valuation Report is an in-depth analysis detailing your home's value as well as a comparison with similar homes in the area
Home Values in the Area
Average Home Value in this Area
Purchase History
| Date | Buyer | Sale Price | Title Company |
|---|---|---|---|
| Wohlford Rentals Inc | $78,000 | Nw Arkansas Title | |
| Scott Tr/Scott Tr | -- | -- | |
| Re: John R Scott Tr | -- | -- | |
| Re: Joellen Scott Tr | -- | -- | |
| Scott | $56,000 | -- | |
| Sharp | $50,000 | -- |
Source: Public Records
Mortgage History
| Date | Status | Borrower | Loan Amount |
|---|---|---|---|
| Closed | Wohlford Rentals Inc | $77,638 |
Source: Public Records
Tax History Compared to Growth
Tax History
| Year | Tax Paid | Tax Assessment Tax Assessment Total Assessment is a certain percentage of the fair market value that is determined by local assessors to be the total taxable value of land and additions on the property. | Land | Improvement |
|---|---|---|---|---|
| 2025 | $1,459 | $34,198 | $1,600 | $32,598 |
| 2024 | $1,324 | $34,198 | $1,600 | $32,598 |
| 2023 | $1,204 | $22,160 | $800 | $21,360 |
| 2022 | $1,147 | $22,160 | $800 | $21,360 |
| 2021 | $1,049 | $22,160 | $800 | $21,360 |
| 2020 | $963 | $15,110 | $600 | $14,510 |
| 2019 | $963 | $15,110 | $600 | $14,510 |
| 2018 | $963 | $15,110 | $600 | $14,510 |
| 2017 | $926 | $15,110 | $600 | $14,510 |
| 2016 | $926 | $15,110 | $600 | $14,510 |
| 2015 | $853 | $14,140 | $1,000 | $13,140 |
| 2014 | $853 | $14,140 | $1,000 | $13,140 |
Source: Public Records
Map
Nearby Homes