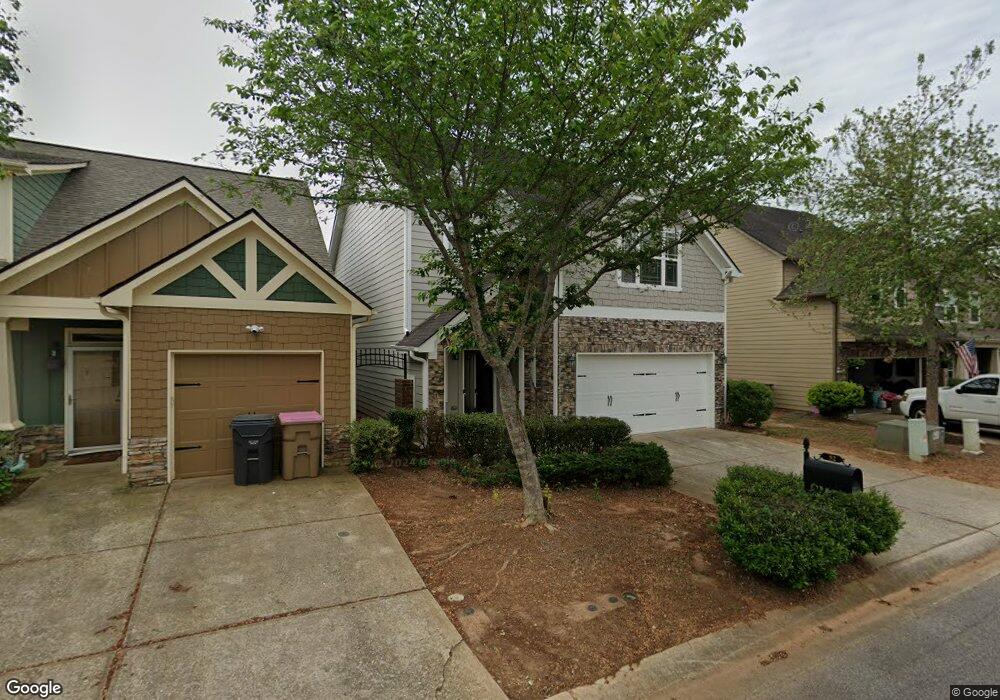
52 Highland Pointe Cir E Dawsonville, GA 30534
Dawson County NeighborhoodEstimated Value: $353,702 - $391,000
3
Beds
3
Baths
2,052
Sq Ft
$180/Sq Ft
Est. Value
About This Home
This home is located at 52 Highland Pointe Cir E, Dawsonville, GA 30534 and is currently estimated at $369,426, approximately $180 per square foot. 52 Highland Pointe Cir E is a home located in Dawson County with nearby schools including Kilough Elementary School, Dawson County Middle School, and Dawson County Junior High School.
Ownership History
Date
Name
Owned For
Owner Type
Purchase Details
Closed on
Jun 23, 2010
Sold by
Federal National Mortgage
Bought by
Fraser James E
Current Estimated Value
Home Financials for this Owner
Home Financials are based on the most recent Mortgage that was taken out on this home.
Original Mortgage
$141,099
Outstanding Balance
$96,989
Interest Rate
5.5%
Mortgage Type
FHA
Estimated Equity
$272,437
Purchase Details
Closed on
Mar 2, 2010
Sold by
Mathis Candace
Bought by
Bac Home Loans
Purchase Details
Closed on
May 16, 2007
Sold by
Not Provided
Bought by
Mathis Candace
Home Financials for this Owner
Home Financials are based on the most recent Mortgage that was taken out on this home.
Original Mortgage
$158,749
Interest Rate
7.38%
Mortgage Type
New Conventional
Purchase Details
Closed on
Dec 18, 2006
Sold by
Not Provided
Bought by
Mathis Candace
Create a Home Valuation Report for This Property
The Home Valuation Report is an in-depth analysis detailing your home's value as well as a comparison with similar homes in the area
Home Values in the Area
Average Home Value in this Area
Purchase History
| Date | Buyer | Sale Price | Title Company |
|---|---|---|---|
| Fraser James E | $143,000 | -- | |
| Bac Home Loans | -- | -- | |
| Mathis Candace | $198,500 | -- | |
| Mathis Candace | $579,500 | -- |
Source: Public Records
Mortgage History
| Date | Status | Borrower | Loan Amount |
|---|---|---|---|
| Open | Fraser James E | $141,099 | |
| Previous Owner | Mathis Candace | $158,749 |
Source: Public Records
Tax History Compared to Growth
Tax History
| Year | Tax Paid | Tax Assessment Tax Assessment Total Assessment is a certain percentage of the fair market value that is determined by local assessors to be the total taxable value of land and additions on the property. | Land | Improvement |
|---|---|---|---|---|
| 2024 | $2,145 | $133,920 | $24,000 | $109,920 |
| 2023 | $2,145 | $144,080 | $24,000 | $120,080 |
| 2022 | $2,423 | $115,120 | $24,000 | $91,120 |
| 2021 | $2,002 | $90,480 | $12,000 | $78,480 |
| 2020 | $2,021 | $87,400 | $12,000 | $75,400 |
| 2019 | $1,851 | $79,560 | $12,000 | $67,560 |
| 2018 | $1,713 | $73,640 | $12,000 | $61,640 |
| 2017 | $1,469 | $63,442 | $12,000 | $51,442 |
| 2016 | $1,424 | $61,552 | $12,000 | $49,552 |
| 2015 | $1,411 | $59,152 | $9,600 | $49,552 |
| 2014 | $1,339 | $54,561 | $9,600 | $44,961 |
| 2013 | -- | $52,262 | $9,600 | $42,662 |
Source: Public Records
Map
Nearby Homes
- 18 Greenfield Dr
- 161 Oakmont Dr
- 157 Highland Pointe Cir E
- 157 Northfield Cir
- 208 Highland Pointe Cir E
- Grenbrier Plan at Castleberry Pointe
- Cambridge Plan at Castleberry Pointe
- Oglethorpe Plan at Castleberry Pointe
- Springdale Plan at Castleberry Pointe
- Addison Plan at Castleberry Pointe
- Brookfield Plan at Castleberry Pointe
- Sweetbriar Plan at Castleberry Pointe
- 21 Berry Dr
- 102 Berry Dr
- 112 Berry Dr
- 112 Berry Dr Unit 25
- 0 Whitmire Dr Unit 10454771
- 0 Whitmire Dr Unit 10431935
- 174 Parkwood Dr
- 152 Parkwood Dr Unit 36
- 58 Highland Pointe Cir E
- 42 Highland Pointe Cir E
- 62 Highland Pointe Cir E
- 34 Highland Pointe Cir E
- 70 Highland Pointe Cir E
- 80 Oakmont Dr
- 28 Highland Pointe Cir E
- 55 Highland Pointe Cir E
- 74 Oakmont Dr
- 74 Oakmont Dr Unit 42
- 28 Highland Pointe Cir E
- 88 Oakmont Dr
- 43 Highland Pointe Cir E
- 59 Highland Pointe Cir E
- 68 Oakmont Dr
- 68 Oakmont Dr Unit 43
- 76 Highland Pointe Cir E
- 33 Highland Pointe Cir E
- 65 Highland Pointe Cir E
- 98 Oakmont Dr