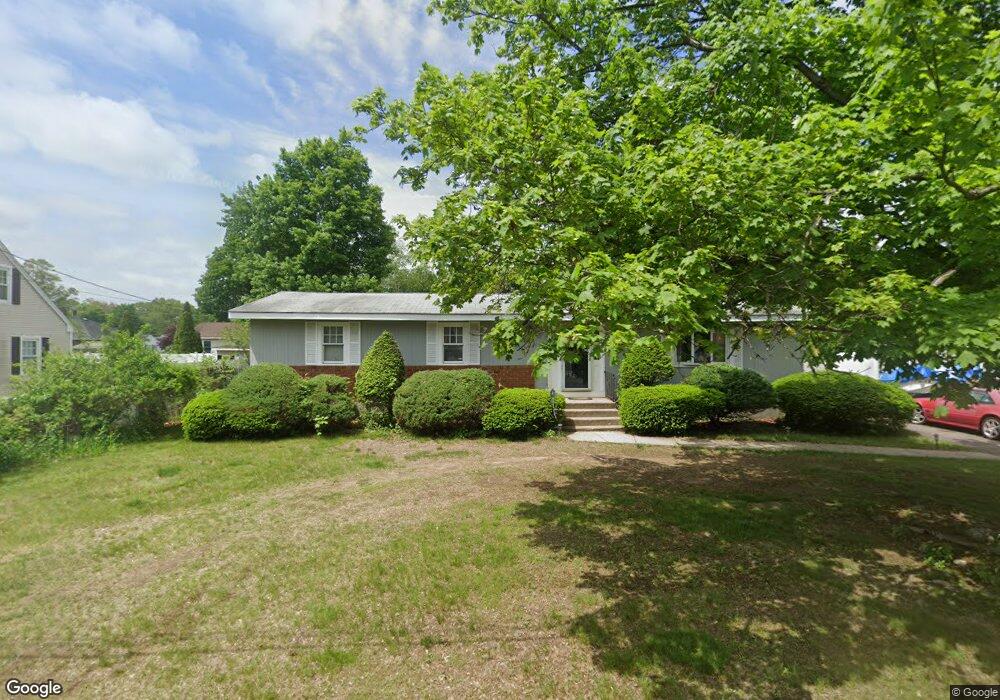
52 Highland St Feeding Hills, MA 01030
Estimated Value: $354,000 - $366,000
3
Beds
2
Baths
1,344
Sq Ft
$268/Sq Ft
Est. Value
About This Home
This home is located at 52 Highland St, Feeding Hills, MA 01030 and is currently estimated at $360,112, approximately $267 per square foot. 52 Highland St is a home located in Hampden County with nearby schools including Agawam Junior High School, Agawam High School, and St Thomas The Apostle School.
Ownership History
Date
Name
Owned For
Owner Type
Purchase Details
Closed on
Jul 2, 2008
Sold by
Moretti Helen M
Bought by
Moretti Darlene and Moretti Mario M
Current Estimated Value
Purchase Details
Closed on
Jun 30, 1998
Sold by
Rossi Christopher M
Bought by
Moretti Helen
Home Financials for this Owner
Home Financials are based on the most recent Mortgage that was taken out on this home.
Original Mortgage
$85,000
Interest Rate
7.09%
Mortgage Type
Purchase Money Mortgage
Purchase Details
Closed on
Sep 16, 1987
Sold by
Moretti Raymond P
Bought by
Rossi Christopher M
Home Financials for this Owner
Home Financials are based on the most recent Mortgage that was taken out on this home.
Original Mortgage
$86,400
Interest Rate
10.35%
Mortgage Type
Purchase Money Mortgage
Purchase Details
Closed on
Jun 29, 1987
Sold by
Moretti Raymond P
Bought by
Moretti Raymond P
Create a Home Valuation Report for This Property
The Home Valuation Report is an in-depth analysis detailing your home's value as well as a comparison with similar homes in the area
Home Values in the Area
Average Home Value in this Area
Purchase History
| Date | Buyer | Sale Price | Title Company |
|---|---|---|---|
| Moretti Darlene | -- | -- | |
| Moretti Helen | $106,250 | -- | |
| Rossi Christopher M | $108,000 | -- | |
| Moretti Raymond P | $16,000 | -- |
Source: Public Records
Mortgage History
| Date | Status | Borrower | Loan Amount |
|---|---|---|---|
| Previous Owner | Moretti Raymond P | $85,000 | |
| Previous Owner | Moretti Raymond P | $45,000 | |
| Previous Owner | Moretti Raymond P | $86,400 |
Source: Public Records
Tax History Compared to Growth
Tax History
| Year | Tax Paid | Tax Assessment Tax Assessment Total Assessment is a certain percentage of the fair market value that is determined by local assessors to be the total taxable value of land and additions on the property. | Land | Improvement |
|---|---|---|---|---|
| 2025 | $4,535 | $309,800 | $102,100 | $207,700 |
| 2024 | $4,448 | $305,900 | $102,100 | $203,800 |
| 2023 | $4,158 | $263,500 | $88,400 | $175,100 |
| 2022 | $3,995 | $248,000 | $88,400 | $159,600 |
| 2021 | $3,701 | $220,300 | $78,000 | $142,300 |
| 2020 | $3,618 | $215,000 | $76,800 | $138,200 |
| 2019 | $3,510 | $210,800 | $75,300 | $135,500 |
| 2018 | $3,345 | $201,400 | $75,300 | $126,100 |
| 2017 | $3,177 | $194,800 | $75,300 | $119,500 |
| 2016 | $3,110 | $192,200 | $75,300 | $116,900 |
| 2015 | $2,942 | $186,900 | $75,300 | $111,600 |
Source: Public Records
Map
Nearby Homes
- 7 Agnoli Place
- 691 Mill St
- 67 Colemore St
- 94 Witheridge St
- lot A North St
- 4 Liquori Dr
- 36-38 Orlando St
- 64 Blairs Hill Rd
- 157 Cambridge St
- 712 Cooper St
- 86 Willow Brook Dr
- 66 Sheri Ln Unit 66
- 60 Elizabeth St
- 468 Springfield St
- 56 Taft St
- 190 Mill St
- 441 Silver St
- 73 Silver Lake Dr
- 200 Anvil St
- 999 N Street Extension