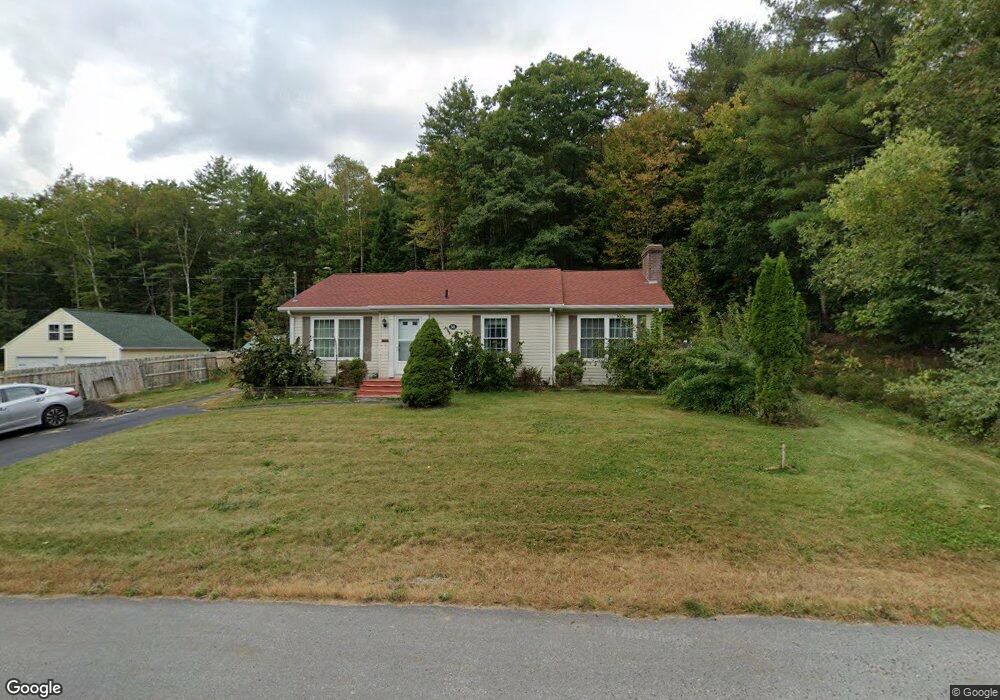
52 Hinkley St Lisbon Falls, ME 04252
Estimated Value: $471,000 - $711,520
3
Beds
3
Baths
2,072
Sq Ft
$286/Sq Ft
Est. Value
About This Home
This home is located at 52 Hinkley St, Lisbon Falls, ME 04252 and is currently estimated at $593,173, approximately $286 per square foot. 52 Hinkley St is a home with nearby schools including Lisbon Community School, Philip W. Sugg Middle School, and Lisbon High School.
Ownership History
Date
Name
Owned For
Owner Type
Purchase Details
Closed on
Feb 1, 2018
Sold by
Larochelle Fernand M
Bought by
Larochelle Fernand M and Stessl Constance L
Current Estimated Value
Home Financials for this Owner
Home Financials are based on the most recent Mortgage that was taken out on this home.
Original Mortgage
$326,900
Interest Rate
3.94%
Mortgage Type
New Conventional
Purchase Details
Closed on
Oct 17, 2011
Sold by
Ar One Realty Corp
Bought by
Larochelle Fernand M
Create a Home Valuation Report for This Property
The Home Valuation Report is an in-depth analysis detailing your home's value as well as a comparison with similar homes in the area
Home Values in the Area
Average Home Value in this Area
Purchase History
| Date | Buyer | Sale Price | Title Company |
|---|---|---|---|
| Larochelle Fernand M | -- | -- | |
| Larochelle Fernand M | -- | -- |
Source: Public Records
Mortgage History
| Date | Status | Borrower | Loan Amount |
|---|---|---|---|
| Closed | Larochelle Fernand M | $326,900 |
Source: Public Records
Tax History Compared to Growth
Tax History
| Year | Tax Paid | Tax Assessment Tax Assessment Total Assessment is a certain percentage of the fair market value that is determined by local assessors to be the total taxable value of land and additions on the property. | Land | Improvement |
|---|---|---|---|---|
| 2024 | $7,723 | $567,900 | $85,800 | $482,100 |
| 2023 | $6,914 | $327,700 | $56,500 | $271,200 |
| 2022 | $7,570 | $327,700 | $56,500 | $271,200 |
| 2021 | $7,242 | $327,700 | $56,500 | $271,200 |
| 2020 | $7,628 | $330,200 | $59,000 | $271,200 |
| 2019 | $7,628 | $330,200 | $59,000 | $271,200 |
| 2018 | $7,201 | $289,900 | $51,300 | $238,600 |
| 2017 | $6,726 | $289,900 | $51,300 | $238,600 |
| 2016 | $6,494 | $289,900 | $51,300 | $238,600 |
| 2015 | $1,001 | $42,440 | $42,440 | $0 |
| 2014 | $1,036 | $42,440 | $42,440 | $0 |
| 2013 | $976 | $42,440 | $42,440 | $0 |
Source: Public Records
Map
Nearby Homes