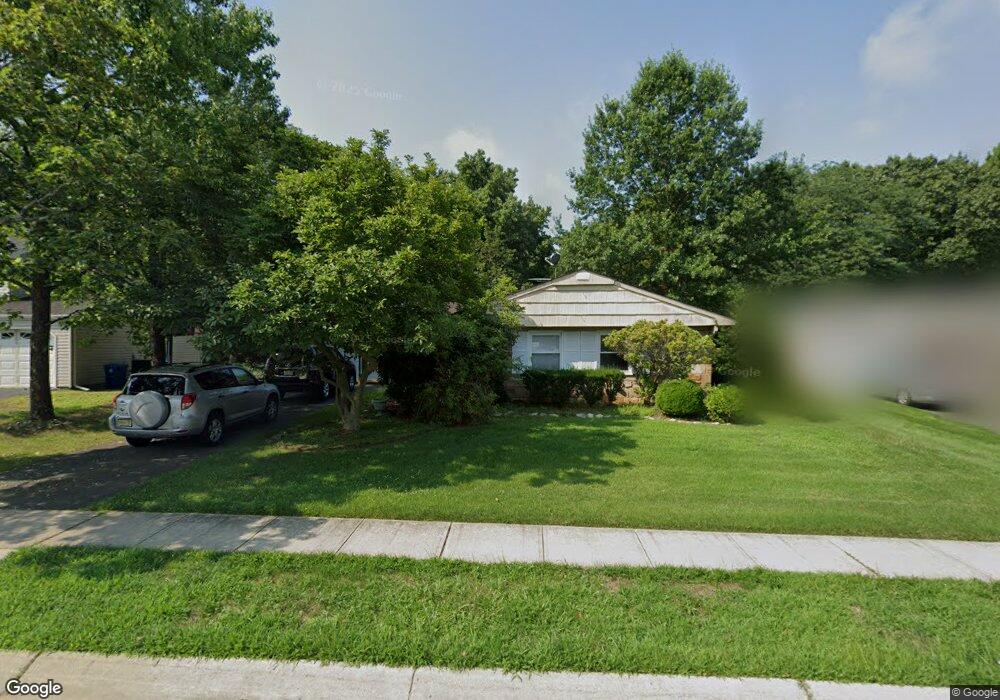
52 Idlewild Ln Matawan, NJ 07747
Estimated Value: $685,506 - $725,000
3
Beds
2
Baths
1,807
Sq Ft
$395/Sq Ft
Est. Value
About This Home
This home is located at 52 Idlewild Ln, Matawan, NJ 07747 and is currently estimated at $712,877, approximately $394 per square foot. 52 Idlewild Ln is a home located in Monmouth County with nearby schools including Matawan Reg High School, St Benedict School, and St. Joseph Elementary School.
Ownership History
Date
Name
Owned For
Owner Type
Purchase Details
Closed on
Aug 31, 2006
Sold by
Gibbons Douglas J
Bought by
Eldin Omar Khair
Current Estimated Value
Home Financials for this Owner
Home Financials are based on the most recent Mortgage that was taken out on this home.
Original Mortgage
$336,000
Outstanding Balance
$202,220
Interest Rate
6.71%
Mortgage Type
New Conventional
Estimated Equity
$510,657
Create a Home Valuation Report for This Property
The Home Valuation Report is an in-depth analysis detailing your home's value as well as a comparison with similar homes in the area
Home Values in the Area
Average Home Value in this Area
Purchase History
| Date | Buyer | Sale Price | Title Company |
|---|---|---|---|
| Eldin Omar Khair | $420,000 | -- |
Source: Public Records
Mortgage History
| Date | Status | Borrower | Loan Amount |
|---|---|---|---|
| Open | Eldin Omar Khair | $336,000 |
Source: Public Records
Tax History Compared to Growth
Tax History
| Year | Tax Paid | Tax Assessment Tax Assessment Total Assessment is a certain percentage of the fair market value that is determined by local assessors to be the total taxable value of land and additions on the property. | Land | Improvement |
|---|---|---|---|---|
| 2025 | $10,913 | $608,700 | $412,100 | $196,600 |
| 2024 | $10,470 | $540,000 | $347,000 | $193,000 |
Source: Public Records
Map
Nearby Homes
- 104 Idolstone Ln
- 537 S Atlantic Ave
- 108 Dundee Ct
- 75 Bradford Ct Unit 75
- 31 Balmoral Ct
- 106 van Brackle Rd
- 5 7th St
- 141 Eastwick Ct Unit 141
- 224 Perth Hill Ct
- 16 Galway Dr
- 208 Haverford Ct
- 244 Lloyd Rd
- 184 Edinburgh Ct Unit 184
- 9 Tralee Rd
- 315 Wellington Place
- 570 Line Rd
- 15 Janine Place
- 101 Cresci Blvd
- 283 Gloucester Ct
- 293 Gloucester Ct