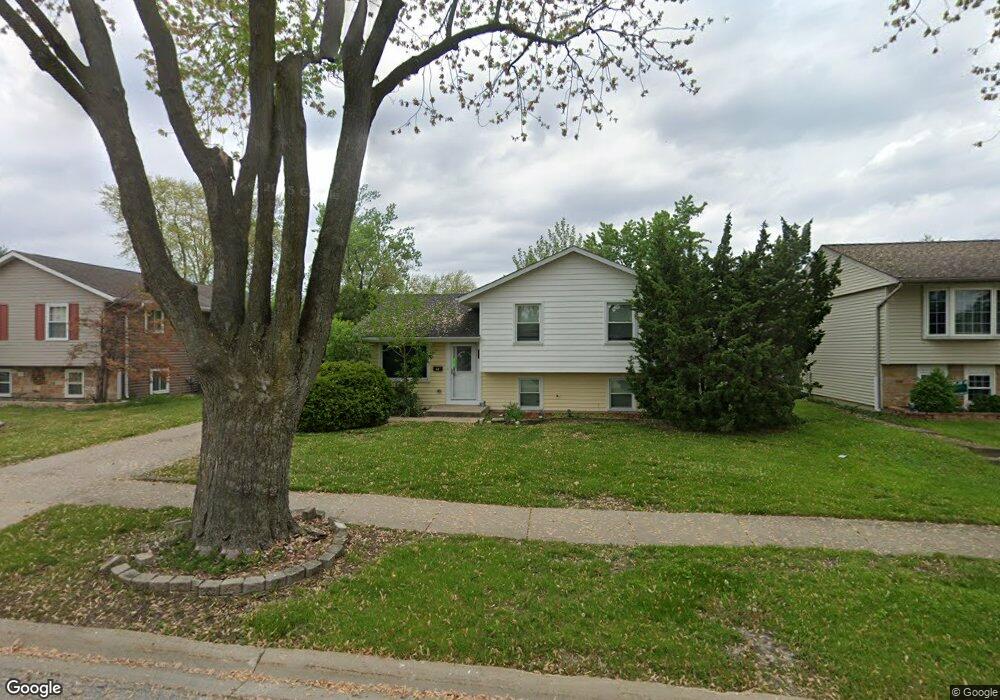
52 Jacobsen Ave Glendale Heights, IL 60139
Estimated Value: $284,000 - $350,000
3
Beds
2
Baths
1,594
Sq Ft
$199/Sq Ft
Est. Value
About This Home
This home is located at 52 Jacobsen Ave, Glendale Heights, IL 60139 and is currently estimated at $317,053, approximately $198 per square foot. 52 Jacobsen Ave is a home located in DuPage County with nearby schools including Glen Hill Primary School, Americana Intermediate School, and Glenside Middle School.
Ownership History
Date
Name
Owned For
Owner Type
Purchase Details
Closed on
May 20, 2019
Sold by
Sheriff Of Dupage County
Bought by
Tinson Ross E and Frias Billy
Current Estimated Value
Purchase Details
Closed on
May 5, 2010
Sold by
Fannie Mae
Bought by
Tinson Ross E and Tinson Ryan C
Home Financials for this Owner
Home Financials are based on the most recent Mortgage that was taken out on this home.
Original Mortgage
$130,246
Interest Rate
4.97%
Mortgage Type
FHA
Purchase Details
Closed on
Feb 9, 2010
Sold by
Nguyen Sandy and Nguyen Paul
Bought by
Federal National Mortgage Association
Purchase Details
Closed on
Jan 13, 2003
Sold by
Vannguyen Thuy Van
Bought by
Nguyen Paul P and Nguyen Sandy S
Home Financials for this Owner
Home Financials are based on the most recent Mortgage that was taken out on this home.
Original Mortgage
$134,000
Interest Rate
6.13%
Purchase Details
Closed on
Jan 5, 2001
Sold by
Scanio Ross A and Scanio Laura A
Bought by
Vannguyen Thuy
Home Financials for this Owner
Home Financials are based on the most recent Mortgage that was taken out on this home.
Original Mortgage
$160,000
Interest Rate
7.69%
Mortgage Type
Stand Alone First
Create a Home Valuation Report for This Property
The Home Valuation Report is an in-depth analysis detailing your home's value as well as a comparison with similar homes in the area
Home Values in the Area
Average Home Value in this Area
Purchase History
| Date | Buyer | Sale Price | Title Company |
|---|---|---|---|
| Tinson Ross E | $140,500 | None Listed On Document | |
| Tinson Ross E | $132,000 | None Available | |
| Federal National Mortgage Association | -- | None Available | |
| Nguyen Paul P | -- | First American Title | |
| Vannguyen Thuy | $160,000 | -- |
Source: Public Records
Mortgage History
| Date | Status | Borrower | Loan Amount |
|---|---|---|---|
| Previous Owner | Tinson Ross E | $130,246 | |
| Previous Owner | Nguyen Paul P | $134,000 | |
| Previous Owner | Vannguyen Thuy | $160,000 |
Source: Public Records
Tax History Compared to Growth
Tax History
| Year | Tax Paid | Tax Assessment Tax Assessment Total Assessment is a certain percentage of the fair market value that is determined by local assessors to be the total taxable value of land and additions on the property. | Land | Improvement |
|---|---|---|---|---|
| 2024 | $8,804 | $96,228 | $23,915 | $72,313 |
| 2023 | $8,568 | $88,000 | $21,870 | $66,130 |
| 2022 | $6,731 | $67,080 | $19,580 | $47,500 |
| 2021 | $6,393 | $63,730 | $18,600 | $45,130 |
| 2020 | $5,571 | $62,180 | $18,150 | $44,030 |
| 2019 | $5,388 | $59,750 | $17,440 | $42,310 |
| 2018 | $6,372 | $62,650 | $16,980 | $45,670 |
| 2017 | $6,176 | $58,070 | $15,740 | $42,330 |
| 2016 | $5,935 | $53,750 | $14,570 | $39,180 |
| 2015 | $5,820 | $50,160 | $13,600 | $36,560 |
| 2014 | $5,568 | $47,890 | $13,600 | $34,290 |
| 2013 | $4,801 | $44,000 | $14,060 | $29,940 |
Source: Public Records
Map
Nearby Homes
- 118 Windsor Ln
- 1500 Golfview Ct Unit 5
- 56 N Golfview Ct
- 108 Golfview Dr
- 179 Glen Hill Dr
- 23W285 Armitage Ave
- 10 W Nevada Ave
- 2N643 Diane Ave
- 134 W Montana Ave
- 2N061 Bloomingdale Rd
- 1188 Harbor Ct Unit 136
- 1148 Harbor Ct Unit 152
- 203 Ahmed Ct
- 1760 Lombard Ct
- 200 Ahmed Ct
- 367 Mark Ave
- 251 Polo Club Dr
- 1713 Schmale Rd
- 23W570 Pine Dr
- 1111 Bloomingdale Rd Unit 1A