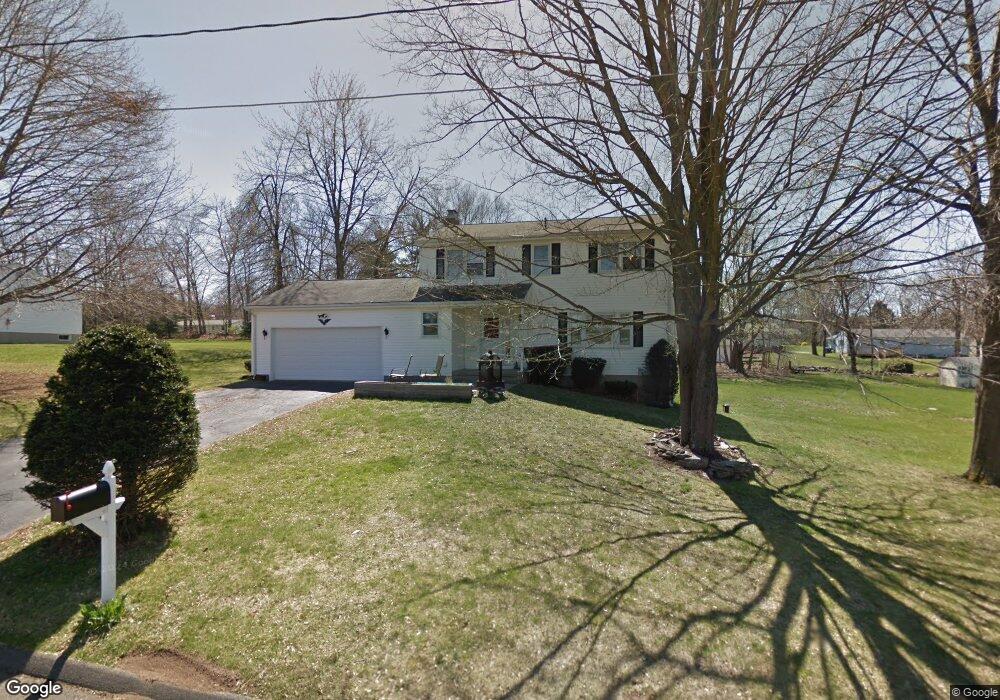
52 Jeff Rd Vernon Rockville, CT 06066
North Vernon NeighborhoodEstimated Value: $416,000 - $470,000
4
Beds
3
Baths
1,940
Sq Ft
$228/Sq Ft
Est. Value
About This Home
This home is located at 52 Jeff Rd, Vernon Rockville, CT 06066 and is currently estimated at $442,938, approximately $228 per square foot. 52 Jeff Rd is a home located in Tolland County with nearby schools including Lake Street School, Vernon Center Middle School, and Rockville High School.
Ownership History
Date
Name
Owned For
Owner Type
Purchase Details
Closed on
Nov 26, 2007
Sold by
Santangelo Stephen
Bought by
Aggarwala Andrew and Aggarwala Sarah
Current Estimated Value
Home Financials for this Owner
Home Financials are based on the most recent Mortgage that was taken out on this home.
Original Mortgage
$220,000
Interest Rate
6.42%
Create a Home Valuation Report for This Property
The Home Valuation Report is an in-depth analysis detailing your home's value as well as a comparison with similar homes in the area
Home Values in the Area
Average Home Value in this Area
Purchase History
| Date | Buyer | Sale Price | Title Company |
|---|---|---|---|
| Aggarwala Andrew | $290,000 | -- |
Source: Public Records
Mortgage History
| Date | Status | Borrower | Loan Amount |
|---|---|---|---|
| Closed | Aggarwala Andrew | $50,000 | |
| Open | Aggarwala Andrew | $204,000 | |
| Closed | Aggarwala Andrew | $217,000 | |
| Closed | Aggarwala Andrew | $220,000 |
Source: Public Records
Tax History Compared to Growth
Tax History
| Year | Tax Paid | Tax Assessment Tax Assessment Total Assessment is a certain percentage of the fair market value that is determined by local assessors to be the total taxable value of land and additions on the property. | Land | Improvement |
|---|---|---|---|---|
| 2025 | $7,112 | $197,060 | $45,280 | $151,780 |
| 2024 | $6,698 | $190,890 | $45,280 | $145,610 |
| 2023 | $6,374 | $190,890 | $45,280 | $145,610 |
| 2022 | $6,374 | $190,890 | $45,280 | $145,610 |
| 2021 | $6,316 | $159,370 | $44,230 | $115,140 |
| 2020 | $6,316 | $159,370 | $44,230 | $115,140 |
| 2019 | $6,316 | $159,370 | $44,230 | $115,140 |
| 2018 | $6,316 | $159,370 | $44,230 | $115,140 |
| 2017 | $6,169 | $159,370 | $44,230 | $115,140 |
| 2016 | $6,067 | $159,530 | $48,080 | $111,450 |
| 2015 | $5,888 | $159,530 | $48,080 | $111,450 |
| 2014 | $5,761 | $159,530 | $48,080 | $111,450 |
Source: Public Records
Map
Nearby Homes