Estimated Value: $694,509 - $1,081,000
About This Home
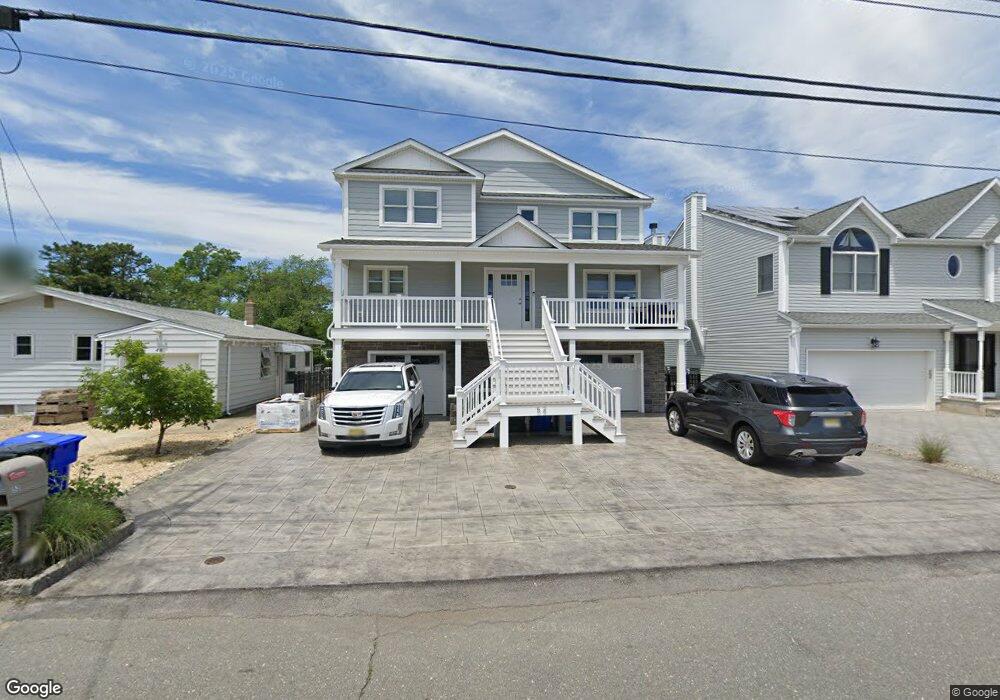
This home is located at 52 Jib Ln, Brick, NJ 08723 and is currently estimated at $847,627, approximately $306 per square foot. 52 Jib Ln is a home located in Ocean County with nearby schools including Drum Point Road Elementary School, Lake Riviera Middle School, and Brick Township High School.
Ownership History
We collect this data history from publicly available records. To have your information removed, we recommend requesting removal directly through your county’s website.
Purchase Details
Home Financials for this Owner
Home Financials are based on the most recent Mortgage that was taken out on this home.Purchase Details
Purchase Details
Home Financials for this Owner
Home Financials are based on the most recent Mortgage that was taken out on this home.Home Values in the Area
Average Home Value in this Area
Purchase History
We collect this data history from publicly available records. To have your information removed, we recommend requesting removal directly through your county’s website.
| Date | Buyer | Sale Price | Title Company |
|---|---|---|---|
| $422,300 | Commonwealth Land Title Insu | ||
| $392,000 | -- | ||
| $152,500 | -- |
Mortgage History
We collect this data history from publicly available records. To have your information removed, we recommend requesting removal directly through your county’s website.
| Date | Status | Borrower | Loan Amount |
|---|---|---|---|
| Open | $84,460 | ||
| Previous Owner | $337,840 | ||
| Previous Owner | $155,550 |
Tax History
We collect this data history from publicly available records. To have your information removed, we recommend requesting removal directly through your county’s website.
| Year | Tax Paid | Tax Assessment Tax Assessment Total Assessment is a certain percentage of the fair market value that is determined by local assessors to be the total taxable value of land and additions on the property. | Land | Improvement |
|---|---|---|---|---|
| 2025 | $13,266 | $488,800 | $256,300 | $232,500 |
| 2024 | $12,000 | $488,800 | $256,300 | $232,500 |
| 2023 | $11,844 | $488,800 | $256,300 | $232,500 |
| 2022 | $11,844 | $488,800 | $256,300 | $232,500 |
| 2021 | $8,926 | $376,300 | $256,300 | $120,000 |
| 2020 | $8,813 | $376,300 | $256,300 | $120,000 |
| 2019 | $8,666 | $376,300 | $256,300 | $120,000 |
| 2018 | $8,467 | $376,300 | $256,300 | $120,000 |
| 2017 | $8,237 | $376,300 | $256,300 | $120,000 |
| 2016 | $8,196 | $376,300 | $256,300 | $120,000 |
| 2015 | $7,981 | $376,300 | $256,300 | $120,000 |
| 2014 | $7,917 | $376,300 | $256,300 | $120,000 |
Map
- 146 Club House Rd
- 183 Cherry Quay Rd
- 89 Club House Rd
- 172 Cherry Quay Rd
- 126 Royal Dr
- 165 Royal Dr
- 57 Club House Rd
- 9 Cross Trees Rd
- 5 Starboard Ct
- 317 Northrop Rd
- 44 Kettle Creek Dr
- 17 Nautilus Dr
- 141 Seaview Ave
- 12 Nautilus Dr
- 22 Queen Ann Rd
- 5 Bay Way
- 21 Queen Ann Rd
- 2 Mariner Place
- 21 Mariner Place
- 136 D St
Ask me questions while you tour the home.