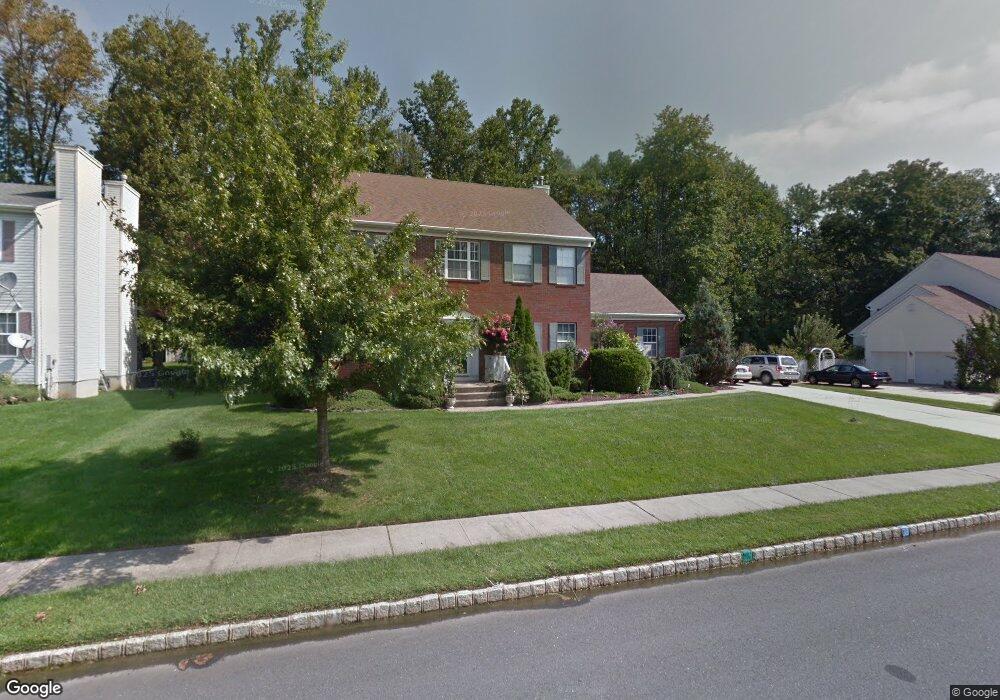
52 Kimberly Ct Monmouth Junction, NJ 08852
Estimated Value: $836,000 - $1,030,000
4
Beds
3
Baths
2,508
Sq Ft
$367/Sq Ft
Est. Value
About This Home
This home is located at 52 Kimberly Ct, Monmouth Junction, NJ 08852 and is currently estimated at $920,125, approximately $366 per square foot. 52 Kimberly Ct is a home located in Middlesex County with nearby schools including Constable Elementary School, Crossroads North Middle School, and South Brunswick High School.
Ownership History
Date
Name
Owned For
Owner Type
Purchase Details
Closed on
Nov 9, 2018
Sold by
Gan Louie Joe Young and Gan Louie Lai
Bought by
Milione Giovanni
Current Estimated Value
Home Financials for this Owner
Home Financials are based on the most recent Mortgage that was taken out on this home.
Original Mortgage
$508,000
Outstanding Balance
$443,990
Interest Rate
4.7%
Mortgage Type
New Conventional
Estimated Equity
$476,135
Purchase Details
Closed on
Apr 30, 1997
Sold by
Nj Vast
Bought by
Louie Joe and Louie Lai Gan
Create a Home Valuation Report for This Property
The Home Valuation Report is an in-depth analysis detailing your home's value as well as a comparison with similar homes in the area
Home Values in the Area
Average Home Value in this Area
Purchase History
| Date | Buyer | Sale Price | Title Company |
|---|---|---|---|
| Milione Giovanni | $635,000 | Westcor Land Title Ins Co | |
| Louie Joe | $266,700 | -- |
Source: Public Records
Mortgage History
| Date | Status | Borrower | Loan Amount |
|---|---|---|---|
| Open | Milione Giovanni | $508,000 |
Source: Public Records
Tax History Compared to Growth
Tax History
| Year | Tax Paid | Tax Assessment Tax Assessment Total Assessment is a certain percentage of the fair market value that is determined by local assessors to be the total taxable value of land and additions on the property. | Land | Improvement |
|---|---|---|---|---|
| 2025 | $15,032 | $274,400 | $90,000 | $184,400 |
| 2024 | $14,464 | $274,400 | $90,000 | $184,400 |
| 2023 | $14,464 | $274,400 | $90,000 | $184,400 |
| 2022 | $14,030 | $274,400 | $90,000 | $184,400 |
| 2021 | $13,970 | $274,400 | $90,000 | $184,400 |
| 2020 | $14,101 | $274,400 | $90,000 | $184,400 |
| 2019 | $14,225 | $274,400 | $90,000 | $184,400 |
| 2018 | $13,356 | $266,700 | $90,000 | $176,700 |
| 2017 | $13,335 | $266,700 | $90,000 | $176,700 |
| 2016 | $13,170 | $266,700 | $90,000 | $176,700 |
| 2015 | $12,716 | $266,700 | $90,000 | $176,700 |
| 2014 | $12,514 | $266,700 | $90,000 | $176,700 |
Source: Public Records
Map
Nearby Homes