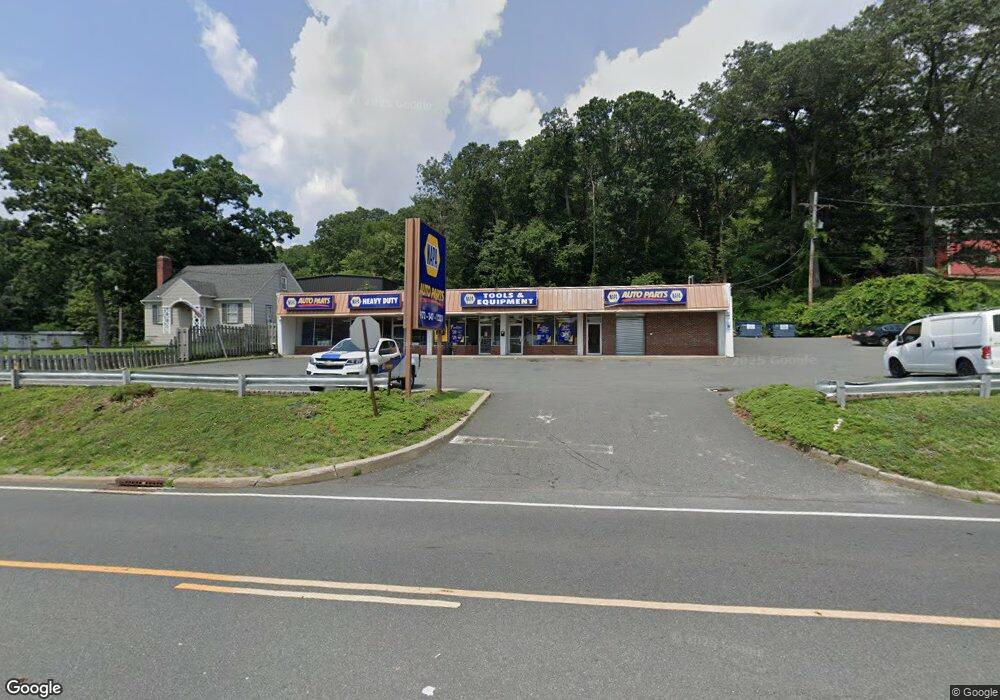
52 Lakeside Blvd Unit 1-5 Hopatcong, NJ 07843
Estimated Value: $1,070,939
--
Bed
--
Bath
--
Sq Ft
1.13
Acres
About This Home
This home is located at 52 Lakeside Blvd Unit 1-5, Hopatcong, NJ 07843 and is currently estimated at $1,070,939. 52 Lakeside Blvd Unit 1-5 is a home located in Sussex County with nearby schools including Durban Avenue Elementary School, Hudson Maxim Elementary School, and Tulsa Trail Elementary School.
Ownership History
Date
Name
Owned For
Owner Type
Purchase Details
Closed on
Mar 19, 2021
Sold by
Brotherhood Properties Llc
Bought by
52 Lakeside Llc
Current Estimated Value
Purchase Details
Closed on
Mar 8, 2017
Sold by
52 Hidden Valley Rentals Llc and Five Two 52 Hidden Valley Rentals
Bought by
Brotherhood Properties and Brotherhood Properties Ll C
Home Financials for this Owner
Home Financials are based on the most recent Mortgage that was taken out on this home.
Interest Rate
4.1%
Purchase Details
Closed on
Jun 24, 2004
Sold by
Hand Thomas D and Hand Regina G
Bought by
Hand Thomas D and Hand Regina G
Purchase Details
Closed on
Aug 7, 2002
Sold by
Morel Builders Llc
Bought by
52 Hidden Valley Rentals Llc
Purchase Details
Closed on
Oct 15, 2001
Sold by
Novus Llc
Bought by
Morel Builders Llc
Purchase Details
Closed on
Dec 1, 1999
Sold by
Lin Hsiu Ching Yang
Bought by
Novus Llc
Create a Home Valuation Report for This Property
The Home Valuation Report is an in-depth analysis detailing your home's value as well as a comparison with similar homes in the area
Home Values in the Area
Average Home Value in this Area
Purchase History
| Date | Buyer | Sale Price | Title Company |
|---|---|---|---|
| 52 Lakeside Llc | $680,000 | Stewart Title Guaranty Co | |
| Brotherhood Properties | $341,000 | -- | |
| Hand Thomas D | -- | -- | |
| 52 Hidden Valley Rentals Llc | -- | Fidelity National Title Ins | |
| Morel Builders Llc | $277,500 | -- | |
| Novus Llc | -- | -- |
Source: Public Records
Mortgage History
| Date | Status | Borrower | Loan Amount |
|---|---|---|---|
| Previous Owner | Brotherhood Properties | -- |
Source: Public Records
Tax History Compared to Growth
Tax History
| Year | Tax Paid | Tax Assessment Tax Assessment Total Assessment is a certain percentage of the fair market value that is determined by local assessors to be the total taxable value of land and additions on the property. | Land | Improvement |
|---|---|---|---|---|
| 2025 | $29,590 | $1,419,200 | $379,900 | $1,039,300 |
| 2024 | $27,992 | $1,419,200 | $379,900 | $1,039,300 |
| 2023 | $27,992 | $800,000 | $278,500 | $521,500 |
| 2022 | $27,440 | $800,000 | $278,500 | $521,500 |
| 2021 | $26,976 | $800,000 | $278,500 | $521,500 |
| 2020 | $26,696 | $800,000 | $278,500 | $521,500 |
| 2019 | $26,584 | $800,000 | $278,500 | $521,500 |
| 2018 | $26,528 | $800,000 | $278,500 | $521,500 |
| 2017 | $31,289 | $945,000 | $278,500 | $666,500 |
| 2016 | $41,903 | $1,262,900 | $278,500 | $984,400 |
| 2015 | $40,956 | $1,262,900 | $278,500 | $984,400 |
| 2014 | $40,817 | $1,262,900 | $278,500 | $984,400 |
Source: Public Records
Map
Nearby Homes
- 8 Brooklyn Mountain Rd
- 54 Point Pleasant Rd
- 12 Lakeside Blvd
- 11 Idalroy Trail
- 214 Durban Ave
- 102 Santa Clara Trail
- 118 Tulsa Trail
- 15 Florence St
- 124 Tulsa Trail
- 19 Squire Rd
- 93 Frances Ave
- 4-6 Celia Ave
- 137 Lakeside Blvd
- 141 W End Ave
- 5 Arthur Rd
- 109 Durban Ave
- 203 Lakeside Blvd
- 4 Regina Ave
- 104 Chincopee Ave
- 322 Flora Ave
- 52 Lakeside Blvd
- 50 Lakeside Blvd
- 62 Lakeside Blvd
- 49 Lakeside Blvd Unit 4
- 49 Lakeside Blvd Unit 3
- 49 Lakeside Blvd Unit 2
- 49 Lakeside Blvd Unit 5
- 53 Lakeside Blvd
- 55 Lakeside Blvd
- 31 W Shore Ave
- 8 Ogden Rd
- 52 Stone Ave
- 64 Lakeside Blvd
- 29 W Shore Ave
- 30 W Shore Ave
- 7 Ogden Rd
- 50 Stone Ave
- 4 Ogden Rd
- 27 W Shore Ave
- 48 Stone Ave