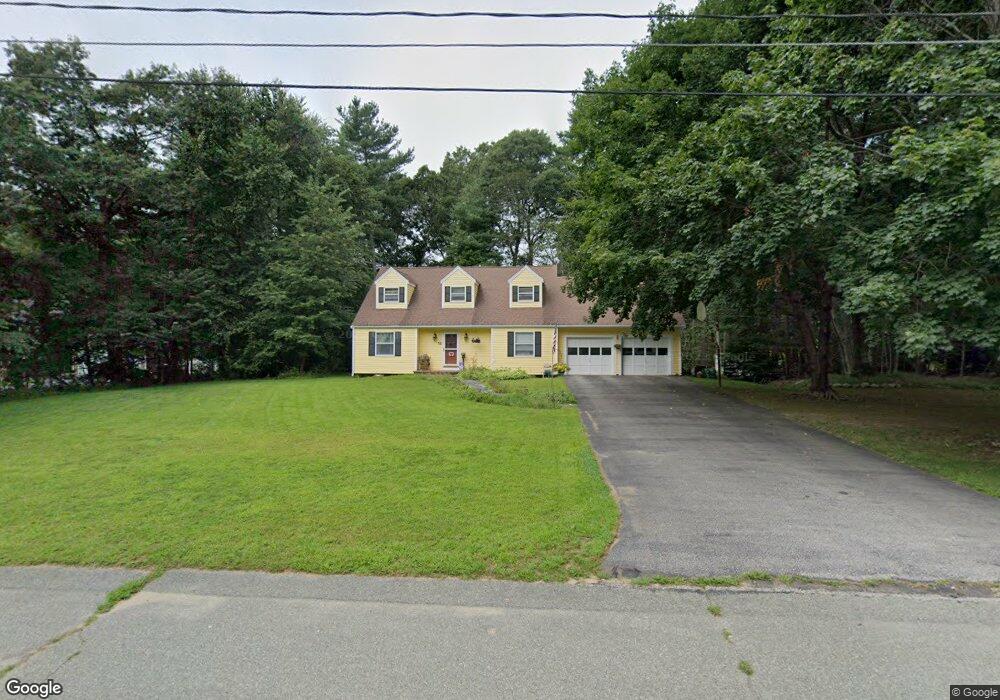
52 Mayflower Rd Hanson, MA 02341
Estimated Value: $663,000 - $772,000
3
Beds
2
Baths
2,176
Sq Ft
$323/Sq Ft
Est. Value
About This Home
This home is located at 52 Mayflower Rd, Hanson, MA 02341 and is currently estimated at $703,455, approximately $323 per square foot. 52 Mayflower Rd is a home located in Plymouth County with nearby schools including Cardinal Cushing Centers.
Ownership History
Date
Name
Owned For
Owner Type
Purchase Details
Closed on
Mar 29, 2021
Sold by
Williams Dwight F and Williams Elizabeth A
Bought by
Williams Ret and Williams
Current Estimated Value
Home Financials for this Owner
Home Financials are based on the most recent Mortgage that was taken out on this home.
Original Mortgage
$150,000
Outstanding Balance
$134,617
Interest Rate
2.9%
Mortgage Type
New Conventional
Estimated Equity
$568,838
Purchase Details
Closed on
Jun 12, 2006
Sold by
Williams Dwight F and Williams Elizabeth A
Bought by
Williams Tr Dwight F and Williams Elizabeth A
Create a Home Valuation Report for This Property
The Home Valuation Report is an in-depth analysis detailing your home's value as well as a comparison with similar homes in the area
Home Values in the Area
Average Home Value in this Area
Purchase History
| Date | Buyer | Sale Price | Title Company |
|---|---|---|---|
| Williams Ret | -- | None Available | |
| Williams Dwight F | -- | None Available | |
| Williams Tr Dwight F | -- | -- |
Source: Public Records
Mortgage History
| Date | Status | Borrower | Loan Amount |
|---|---|---|---|
| Open | Williams Ret | $150,000 | |
| Previous Owner | Williams Tr Dwight F | $100,000 | |
| Previous Owner | Williams Tr Dwight F | $120,000 |
Source: Public Records
Tax History
| Year | Tax Paid | Tax Assessment Tax Assessment Total Assessment is a certain percentage of the fair market value that is determined by local assessors to be the total taxable value of land and additions on the property. | Land | Improvement |
|---|---|---|---|---|
| 2025 | $7,786 | $581,900 | $190,200 | $391,700 |
| 2024 | $7,633 | $570,500 | $184,700 | $385,800 |
| 2023 | $7,450 | $525,400 | $184,700 | $340,700 |
| 2022 | $7,212 | $477,900 | $167,900 | $310,000 |
| 2021 | $6,507 | $430,900 | $161,500 | $269,400 |
| 2020 | $6,413 | $420,000 | $156,000 | $264,000 |
| 2019 | $6,110 | $393,400 | $153,000 | $240,400 |
| 2018 | $5,990 | $378,400 | $147,100 | $231,300 |
| 2017 | $5,809 | $363,500 | $140,100 | $223,400 |
| 2016 | $5,857 | $353,900 | $140,100 | $213,800 |
| 2015 | $5,550 | $348,600 | $140,100 | $208,500 |
Source: Public Records
Map
Nearby Homes
- 127 Crescent Place
- 269 Lakeside Rd
- 339 State St
- 134 Crescent St
- 430 Brook Bend Rd
- 161 Winter St Unit 11
- 26 Stonebridge Dr
- 139 Fairwood Dr
- 66 Wildwood Rd
- 108 Waterford Dr
- Lot 6 Way
- 51 Farmside Dr
- 84 Liberty St
- 285 W Elm St
- 7 Farmside Dr
- Lot 5 Princeton Way
- 60 Summer Path Way
- 114 Graham Hill Dr
- 7 Andrew Dr
- 361 County Rd
Your Personal Tour Guide
Ask me questions while you tour the home.