C
Seller's Agent in 2013
Chart House, Realtors
Chart House, REALTORS®
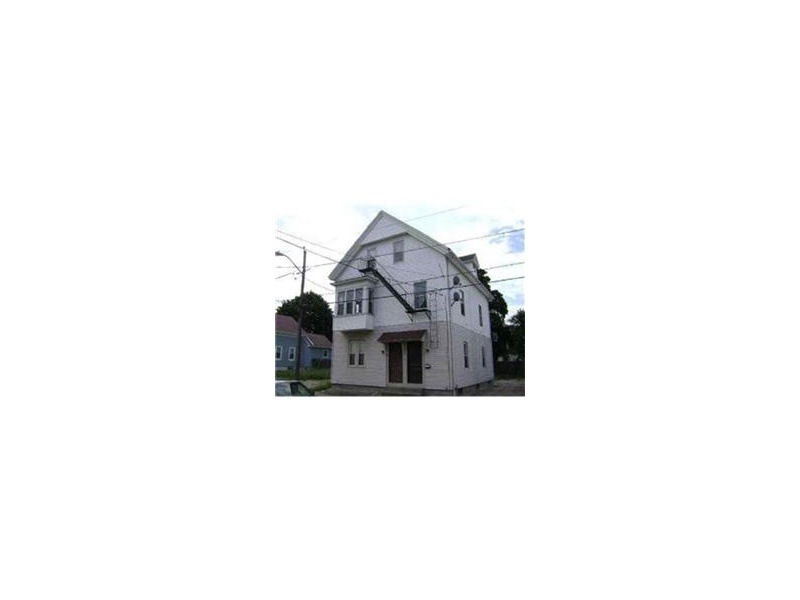
This home is located at 52 Merrick St, Pawtucket, RI 02860 and is currently priced at $130,000, approximately $55 per square foot. This property was built in 1900. 52 Merrick St is a home located in Providence County with nearby schools including International Charter School, Blackstone Academy Charter School, and Ocean Tides School.
Last Agent to Sell the Property
Chart House, Realtors
Chart House, REALTORS® Listed on: 09/19/2013
Last Buyer's Agent
M.B.A. Realty Group
Keller Williams Realty Nri
| Date | Type | Sale Price | Title Company |
|---|---|---|---|
| Warranty Deed | $130,000 | -- | |
| Warranty Deed | $67,000 | -- | |
| Deed | -- | -- | |
| Foreclosure Deed | $354,649 | -- | |
| Deed | $345,000 | -- | |
| Deed | $193,200 | -- |
| Date | Status | Loan Amount | Loan Type |
|---|---|---|---|
| Open | $330,000 | Stand Alone Refi Refinance Of Original Loan | |
| Closed | $100,000 | Balloon | |
| Closed | $97,500 | New Conventional | |
| Previous Owner | $109,000 | No Value Available | |
| Previous Owner | $70,000 | No Value Available |
| Date | Event | Price | Change | Sq Ft Price |
|---|---|---|---|---|
| 09/19/2013 09/19/13 | Sold | $130,000 | -6.5% | $56 / Sq Ft |
| 09/19/2013 09/19/13 | For Sale | $139,000 | +6.9% | $60 / Sq Ft |
| 05/28/2013 05/28/13 | Sold | $130,000 | 0.0% | $45 / Sq Ft |
| 05/28/2013 05/28/13 | Sold | $130,000 | -6.5% | $56 / Sq Ft |
| 04/28/2013 04/28/13 | Pending | -- | -- | -- |
| 04/08/2013 04/08/13 | Pending | -- | -- | -- |
| 12/07/2012 12/07/12 | For Sale | $139,000 | 0.0% | $48 / Sq Ft |
| 09/21/2012 09/21/12 | Price Changed | $139,000 | -6.7% | $60 / Sq Ft |
| 08/08/2012 08/08/12 | For Sale | $149,000 | -- | $64 / Sq Ft |
| Year | Tax Paid | Tax Assessment Tax Assessment Total Assessment is a certain percentage of the fair market value that is determined by local assessors to be the total taxable value of land and additions on the property. | Land | Improvement |
|---|---|---|---|---|
| 2024 | $5,456 | $442,100 | $110,200 | $331,900 |
| 2023 | $4,382 | $258,700 | $49,600 | $209,100 |
| 2022 | $4,289 | $258,700 | $49,600 | $209,100 |
| 2021 | $4,289 | $258,700 | $49,600 | $209,100 |
| 2020 | $3,658 | $175,100 | $50,200 | $124,900 |
| 2019 | $3,658 | $175,100 | $50,200 | $124,900 |
| 2018 | $3,525 | $175,100 | $50,200 | $124,900 |
| 2017 | $3,299 | $145,200 | $38,400 | $106,800 |
| 2016 | $3,178 | $145,200 | $38,400 | $106,800 |
| 2015 | $3,178 | $145,200 | $38,400 | $106,800 |
| 2014 | $2,809 | $121,800 | $49,400 | $72,400 |
C
Seller's Agent in 2013
Chart House, Realtors
Chart House, REALTORS®
C
Seller's Agent in 2013
Chart House Realtors Group
Keller Williams Realty Leading Edge
M
Buyer's Agent in 2013
M.B.A. Realty Group
Keller Williams Realty Nri
J
Buyer's Agent in 2013
Jack Galvao
Realty Quest Group Inc
(401) 345-4636
1 in this area
24 Total Sales
Source: State-Wide MLS
MLS Number: 1051437
APN: PAWT-000052-000000-000024
Disclaimer: Certain information contained herein is derived from information provided by parties other than Homes.com. All information provided is deemed reliable, but is not guaranteed to be accurate and should be independently verified.
![]() IDX information is provided exclusively for personal, non-commercial use, and may not be used for any purpose other than to identify prospective properties consumers may be interested in purchasing. Information is deemed reliable but not guaranteed.
IDX information is provided exclusively for personal, non-commercial use, and may not be used for any purpose other than to identify prospective properties consumers may be interested in purchasing. Information is deemed reliable but not guaranteed.
Copyright © 2025 State-Wide MLS, Inc. All rights reserved.
