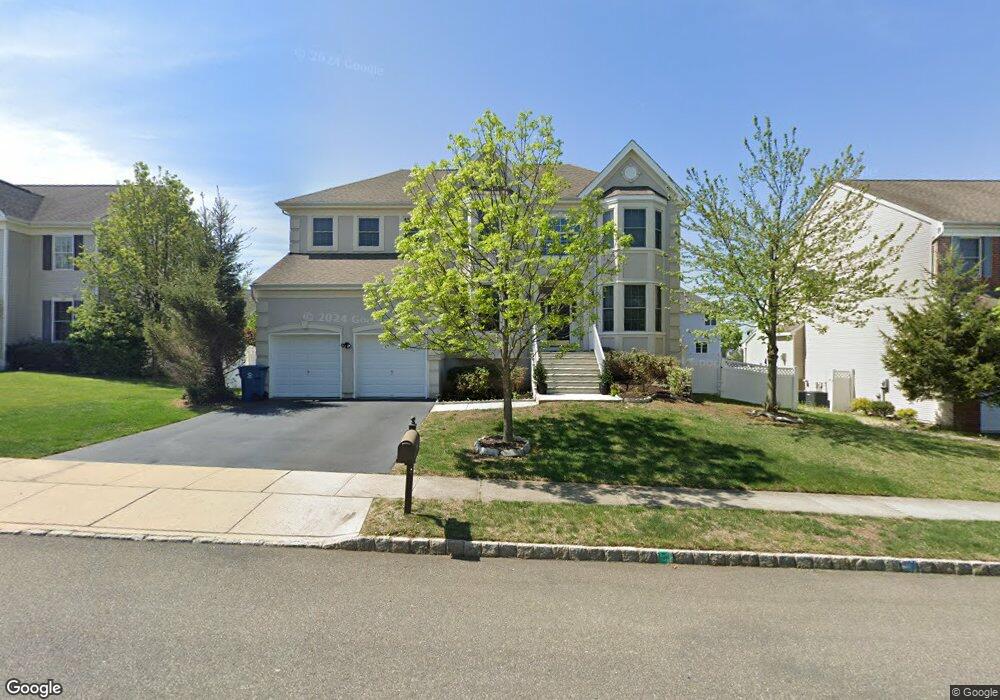
52 Morris Dr Old Bridge, NJ 08857
Estimated Value: $979,000 - $1,136,000
--
Bed
--
Bath
3,348
Sq Ft
$312/Sq Ft
Est. Value
About This Home
This home is located at 52 Morris Dr, Old Bridge, NJ 08857 and is currently estimated at $1,044,793, approximately $312 per square foot. 52 Morris Dr is a home located in Middlesex County with nearby schools including Old Bridge High School, St. Ambrose School, and Calvary Christian School.
Ownership History
Date
Name
Owned For
Owner Type
Purchase Details
Closed on
Apr 28, 2005
Sold by
K Hovnanian At Old Bridge Llc
Bought by
Goel Deepak and Goel Neelam
Current Estimated Value
Home Financials for this Owner
Home Financials are based on the most recent Mortgage that was taken out on this home.
Original Mortgage
$180,000
Outstanding Balance
$91,795
Interest Rate
5.5%
Mortgage Type
Adjustable Rate Mortgage/ARM
Estimated Equity
$952,998
Create a Home Valuation Report for This Property
The Home Valuation Report is an in-depth analysis detailing your home's value as well as a comparison with similar homes in the area
Home Values in the Area
Average Home Value in this Area
Purchase History
| Date | Buyer | Sale Price | Title Company |
|---|---|---|---|
| Goel Deepak | $580,379 | -- | |
| -- | $580,400 | -- |
Source: Public Records
Mortgage History
| Date | Status | Borrower | Loan Amount |
|---|---|---|---|
| Open | -- | $180,000 | |
| Closed | -- | $180,000 |
Source: Public Records
Tax History Compared to Growth
Tax History
| Year | Tax Paid | Tax Assessment Tax Assessment Total Assessment is a certain percentage of the fair market value that is determined by local assessors to be the total taxable value of land and additions on the property. | Land | Improvement |
|---|---|---|---|---|
| 2025 | $16,258 | $287,900 | $115,500 | $172,400 |
| 2024 | $15,596 | $287,900 | $115,500 | $172,400 |
| 2023 | $15,596 | $287,900 | $115,500 | $172,400 |
| 2022 | $15,239 | $287,900 | $115,500 | $172,400 |
| 2021 | $14,789 | $287,900 | $115,500 | $172,400 |
| 2020 | $14,789 | $287,900 | $115,500 | $172,400 |
| 2019 | $14,539 | $287,900 | $115,500 | $172,400 |
| 2018 | $14,378 | $287,900 | $115,500 | $172,400 |
| 2017 | $13,911 | $287,900 | $115,500 | $172,400 |
| 2016 | $13,623 | $287,900 | $115,500 | $172,400 |
| 2015 | $13,387 | $287,900 | $115,500 | $172,400 |
| 2014 | $13,252 | $287,900 | $115,500 | $172,400 |
Source: Public Records
Map
Nearby Homes
- 40 Nathan Dr
- 6 Macbeth Dr
- 20 Heathrow Ln
- 27 Oakland Rd
- 37 Walden Ct
- 97 Osprey Dr
- 19 Ellen Cir
- 8 Amber Dr Unit C1
- 11 Daffodil Way
- 78 Norman Ln
- 3 Irene Ct
- 51 Malibu Ct
- 20 Valley Vale Dr
- 143 Ticetown Rd
- 43 Frederick Place
- 2206 Falston Cir
- 157 Goldmine Ln
- 5213 Falston Cir Unit 13
- 90 Foxwood Place
- 56 Emerald Ln