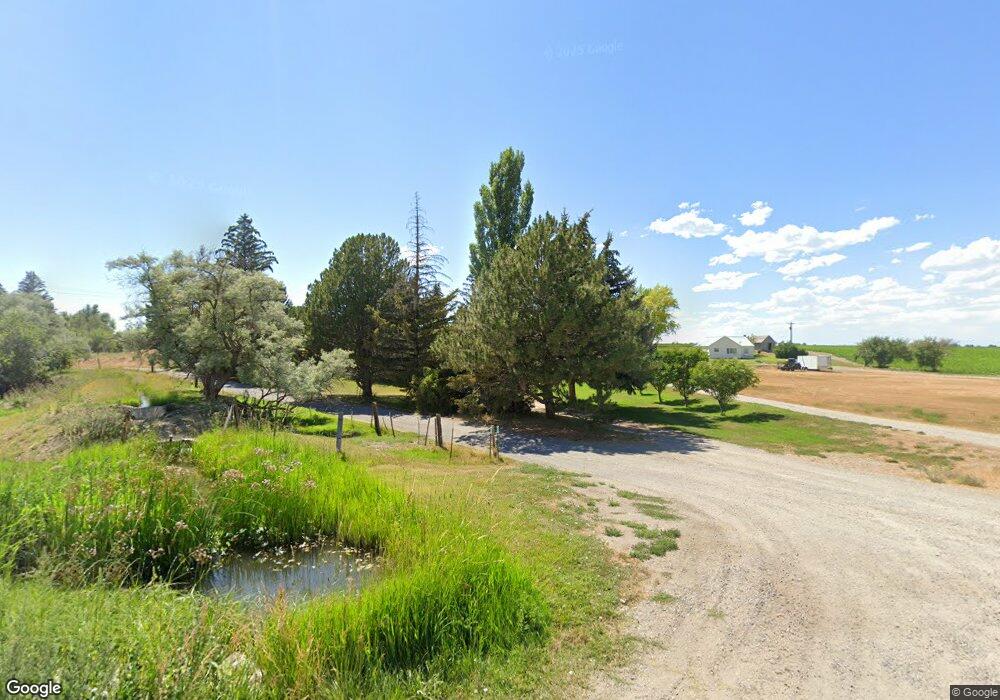
52 N 900 W Blackfoot, ID 83221
Estimated Value: $388,594 - $543,000
4
Beds
3
Baths
2,347
Sq Ft
$188/Sq Ft
Est. Value
About This Home
This home is located at 52 N 900 W, Blackfoot, ID 83221 and is currently estimated at $440,149, approximately $187 per square foot. 52 N 900 W is a home located in Bingham County with nearby schools including Riverside Elementary School, Moreland Elementary School, and Rockford Elementary School.
Ownership History
Date
Name
Owned For
Owner Type
Purchase Details
Closed on
Sep 10, 2009
Sold by
Federal National Mortgage Association
Bought by
Morgan Heidi Lyn and Morgan Keenn Klint
Current Estimated Value
Home Financials for this Owner
Home Financials are based on the most recent Mortgage that was taken out on this home.
Original Mortgage
$152,500
Outstanding Balance
$108,724
Interest Rate
5.18%
Mortgage Type
USDA
Estimated Equity
$331,425
Purchase Details
Closed on
May 25, 2007
Sold by
Gerber Heidi J and Gerber Andrew
Bought by
Gerber Andrew
Purchase Details
Closed on
Jun 7, 2006
Sold by
Hansen Alicia and Hansen George A
Bought by
Earl Richard D and Earl Tiffany D
Home Financials for this Owner
Home Financials are based on the most recent Mortgage that was taken out on this home.
Original Mortgage
$117,600
Interest Rate
6.37%
Mortgage Type
Adjustable Rate Mortgage/ARM
Create a Home Valuation Report for This Property
The Home Valuation Report is an in-depth analysis detailing your home's value as well as a comparison with similar homes in the area
Home Values in the Area
Average Home Value in this Area
Purchase History
| Date | Buyer | Sale Price | Title Company |
|---|---|---|---|
| Morgan Heidi Lyn | -- | -- | |
| Gerber Andrew | -- | -- | |
| Earl Richard D | -- | -- | |
| Earl Richard D | -- | -- |
Source: Public Records
Mortgage History
| Date | Status | Borrower | Loan Amount |
|---|---|---|---|
| Open | Morgan Heidi Lyn | $152,500 | |
| Previous Owner | Earl Richard D | $117,600 | |
| Previous Owner | Earl Richard D | $22,050 |
Source: Public Records
Tax History Compared to Growth
Tax History
| Year | Tax Paid | Tax Assessment Tax Assessment Total Assessment is a certain percentage of the fair market value that is determined by local assessors to be the total taxable value of land and additions on the property. | Land | Improvement |
|---|---|---|---|---|
| 2025 | $1,225 | $369,499 | $70,000 | $299,499 |
| 2024 | $1,225 | $354,499 | $55,000 | $299,499 |
| 2023 | $1,460 | $354,499 | $55,000 | $299,499 |
| 2022 | $2,204 | $281,893 | $55,000 | $226,893 |
| 2021 | $1,469 | $244,298 | $47,000 | $197,298 |
| 2020 | $1,327 | $199,808 | $0 | $0 |
| 2019 | $1,453 | $199,808 | $0 | $0 |
| 2018 | $1,287 | $163,100 | $32,000 | $131,100 |
| 2017 | $1,263 | $156,100 | $25,000 | $131,100 |
| 2016 | $1,257 | $156,100 | $0 | $0 |
| 2015 | $1,134 | $156,100 | $0 | $0 |
| 2014 | $1,134 | $156,100 | $25,000 | $131,100 |
Source: Public Records
Map
Nearby Homes