52 N Bay Rd Osterville, MA 2655
Osterville NeighborhoodEstimated Value: $758,000
Studio
--
Bath
--
Sq Ft
66,211
Sq Ft Lot
About This Home
This home is located at 52 N Bay Rd, Osterville, MA 2655 and is currently priced at $758,000. 52 N Bay Rd is a home located in Barnstable County with nearby schools including West Villages Elementary School, Barnstable United Elementary School, and Barnstable Intermediate School.
Ownership History
Date
Name
Owned For
Owner Type
Purchase Details
Closed on
May 18, 2023
Sold by
72 & 52 North Bay Rt and Gill
Bought by
72 -52 North Bay Llc
Current Estimated Value
Purchase Details
Closed on
Sep 21, 2021
Sold by
Emerald Development Corp
Bought by
72 & 52 North Bay Rt and Gill
Home Financials for this Owner
Home Financials are based on the most recent Mortgage that was taken out on this home.
Original Mortgage
$2,500,000
Interest Rate
2.63%
Mortgage Type
Purchase Money Mortgage
Purchase Details
Closed on
Jul 20, 2021
Sold by
Bart & Mary Tomlinson Ret and Ryan
Bought by
Emerald Development Corp
Create a Home Valuation Report for This Property
The Home Valuation Report is an in-depth analysis detailing your home's value as well as a comparison with similar homes in the area
Home Values in the Area
Average Home Value in this Area
Purchase History
| Date | Buyer | Sale Price | Title Company |
|---|---|---|---|
| 72 -52 North Bay Llc | -- | None Available | |
| 72 -52 North Bay Llc | -- | None Available | |
| 72 & 52 North Bay Rt | $5,000,000 | None Available | |
| Emerald Development Corp | $3,500,000 | None Available |
Source: Public Records
Mortgage History
| Date | Status | Borrower | Loan Amount |
|---|---|---|---|
| Previous Owner | 72 & 52 North Bay Rt | $2,500,000 |
Source: Public Records
Tax History
| Year | Tax Paid | Tax Assessment Tax Assessment Total Assessment is a certain percentage of the fair market value that is determined by local assessors to be the total taxable value of land and additions on the property. | Land | Improvement |
|---|---|---|---|---|
| 2025 | $4,040 | $499,400 | $400,200 | $99,200 |
| 2024 | $3,908 | $500,400 | $400,200 | $100,200 |
| 2023 | $4,173 | $500,400 | $400,200 | $100,200 |
| 2022 | $5,786 | $600,200 | $500,000 | $100,200 |
| 2021 | $5,997 | $571,700 | $471,500 | $100,200 |
| 2020 | $4,377 | $399,400 | $301,400 | $98,000 |
| 2019 | $4,601 | $407,900 | $301,400 | $106,500 |
| 2018 | $4,943 | $428,100 | $317,300 | $110,800 |
| 2017 | $4,644 | $431,600 | $317,300 | $114,300 |
| 2016 | $4,704 | $431,600 | $317,300 | $114,300 |
| 2015 | $5,225 | $481,600 | $359,300 | $122,300 |
Source: Public Records
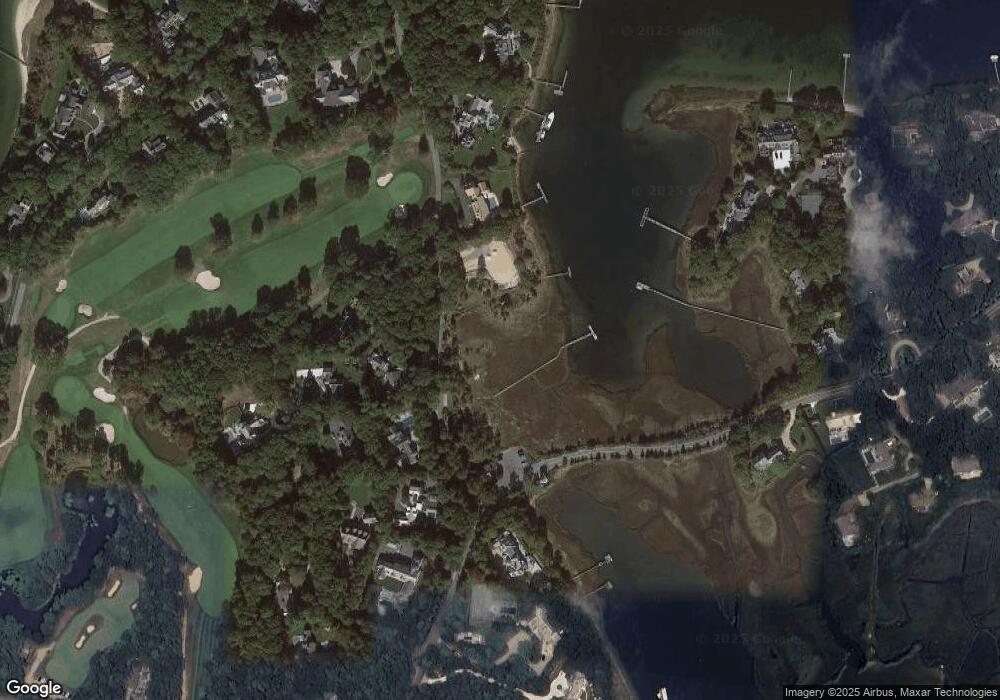
Map
Nearby Homes
- 25 Oyster Way
- 71 Sand Point
- 835 Old Post Rd
- 564 Cotuit Bay Dr
- 564 Cotuit Bay Dr
- Lot 289 Seapuit River B Rd
- Lot 288 Seapuit River A Rd
- 440 Grand Island Dr
- 14 Indian Trail
- 165 Baxter Neck Rd
- Lot 289 Seapuit River Road B
- Lot 288 Seapuit River Rd A
- 240 Baxters Neck Rd
- 359 Baxter Neck Rd
- 168 Garrison Ln
- 67 Fire Station Rd
- 414 Eel
- 135 Putnam Avenue (Land)
- 98 Bunker Hill Rd
- 33 Sunset Ln
Your Personal Tour Guide
Ask me questions while you tour the home.