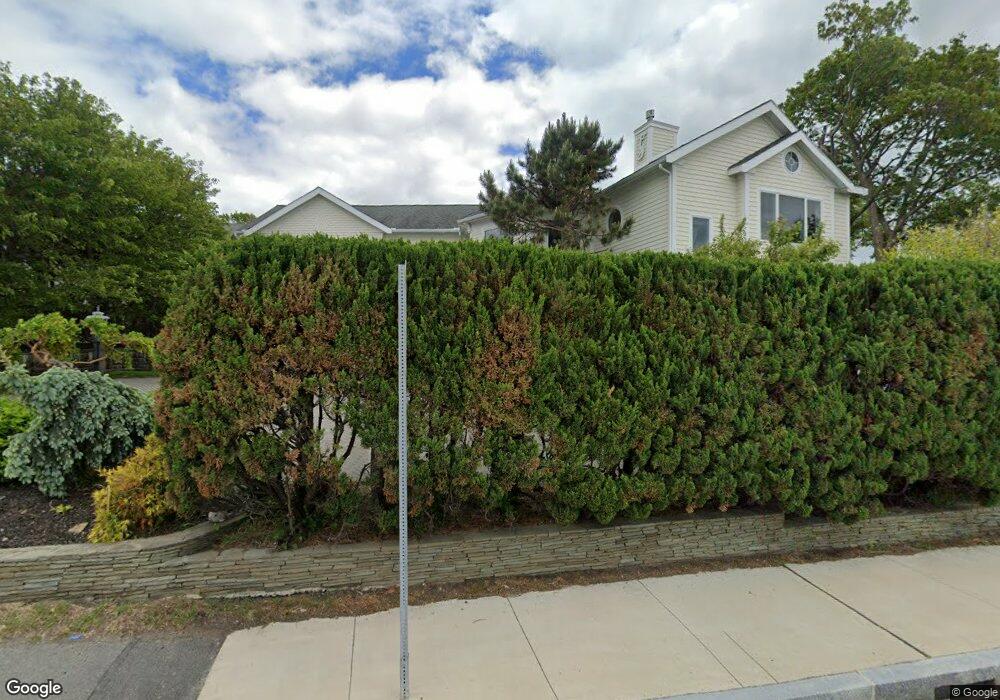
52 Nahant Rd Nahant, MA 01908
Estimated Value: $1,976,000 - $2,914,000
4
Beds
3
Baths
4,757
Sq Ft
$501/Sq Ft
Est. Value
About This Home
This home is located at 52 Nahant Rd, Nahant, MA 01908 and is currently estimated at $2,384,253, approximately $501 per square foot. 52 Nahant Rd is a home located in Essex County with nearby schools including Johnson Elementary School, Swampscott Middle School, and Swampscott High School.
Ownership History
Date
Name
Owned For
Owner Type
Purchase Details
Closed on
Jul 21, 2000
Sold by
Kalogianis Anastasios
Bought by
Petrucci Marie and Petrucci Ronald J
Current Estimated Value
Create a Home Valuation Report for This Property
The Home Valuation Report is an in-depth analysis detailing your home's value as well as a comparison with similar homes in the area
Home Values in the Area
Average Home Value in this Area
Purchase History
We collect this data history from publicly available records. To have your information removed, we recommend requesting removal directly through your county’s website.
| Date | Buyer | Sale Price | Title Company |
|---|---|---|---|
| Petrucci Marie | $250,000 | -- | |
| Petrucci Marie | $250,000 | -- |
Source: Public Records
Mortgage History
We collect this data history from publicly available records. To have your information removed, we recommend requesting removal directly through your county’s website.
| Date | Status | Borrower | Loan Amount |
|---|---|---|---|
| Open | Petrucci Marie | $357,800 | |
| Closed | Petrucci Marie | $440,000 | |
| Closed | Petrucci Marie | $340,000 |
Source: Public Records
Tax History
| Year | Tax Paid | Tax Assessment Tax Assessment Total Assessment is a certain percentage of the fair market value that is determined by local assessors to be the total taxable value of land and additions on the property. | Land | Improvement |
|---|---|---|---|---|
| 2025 | $20,166 | $2,203,900 | $695,700 | $1,508,200 |
| 2024 | $19,595 | $2,160,400 | $652,200 | $1,508,200 |
| 2023 | $17,825 | $1,960,900 | $574,000 | $1,386,900 |
| 2022 | $18,342 | $1,873,500 | $521,800 | $1,351,700 |
| 2021 | $18,121 | $1,724,200 | $478,300 | $1,245,900 |
| 2020 | $17,342 | $1,580,900 | $478,300 | $1,102,600 |
| 2019 | $15,751 | $1,443,700 | $460,900 | $982,800 |
| 2018 | $14,352 | $1,400,200 | $417,400 | $982,800 |
| 2017 | $14,877 | $1,420,900 | $417,400 | $1,003,500 |
| 2016 | $14,543 | $1,382,400 | $408,700 | $973,700 |
| 2015 | $13,514 | $1,237,500 | $371,800 | $865,700 |
| 2014 | $13,910 | $1,261,100 | $371,800 | $889,300 |
Source: Public Records
Map
Nearby Homes
- 250 Wilson Rd
- 51 Fox Hill Rd
- 43 Maple Ave
- 22 Sherman Ave
- 1 Goddard Dr
- 66 Ocean St
- 85 Willow Rd
- 5 Cottage St
- 303 Nahant Rd
- 162 Willow Rd Unit 11
- 6 Desmond Dr
- 51 Cliff St
- 21 Harrington Ave
- 150 Lynnway Unit 403
- 150 Lynnway Unit 702
- 150 Lynnway Unit 406
- 154 Lynnway Unit 210
- 154 Lynnway Unit 205
- 300 Lynn Shore Dr Unit 207
- 300 Lynn Shore Dr Unit 210
- 3 Howe Rd
- 1 Little Nahant Rd
- 5 Little Nahant Rd
- 5 Howe Rd
- 2 Little Nahant Rd
- 2 Howe Rd
- 4 Little Nahant Rd
- 8 Little Nahant Rd
- 7 Howe Rd
- 4 Howe Rd
- 123 Nahant Rd Unit 2
- 123 Nahant Rd
- 42 Nahant Rd
- 11 Howe Rd
- 4 Chamberlain Cir
- 11 Little Nahant Rd
- 15 Howe Rd
- 10 Chamberlain Cir
- 38 Nahant Rd
- 38 Nahant Rd Unit 1
Your Personal Tour Guide
Ask me questions while you tour the home.