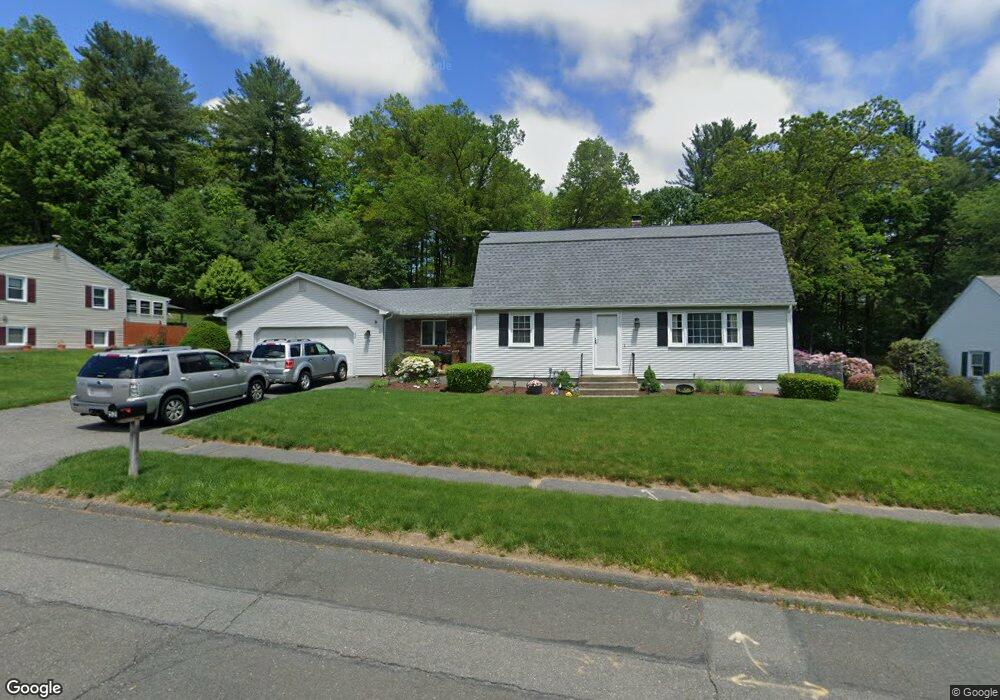
52 Old Farm Rd Westfield, MA 01085
Estimated Value: $444,000 - $514,000
3
Beds
2
Baths
1,896
Sq Ft
$246/Sq Ft
Est. Value
About This Home
This home is located at 52 Old Farm Rd, Westfield, MA 01085 and is currently estimated at $466,762, approximately $246 per square foot. 52 Old Farm Rd is a home located in Hampden County with nearby schools including Westfield High School and Saint Mary High School.
Ownership History
Date
Name
Owned For
Owner Type
Purchase Details
Closed on
Jun 27, 2008
Sold by
Willard Glenn M and Dunn Jennifer C
Bought by
Prystowski Erin E and Prystowski James J
Current Estimated Value
Home Financials for this Owner
Home Financials are based on the most recent Mortgage that was taken out on this home.
Original Mortgage
$238,350
Interest Rate
6.07%
Mortgage Type
Purchase Money Mortgage
Purchase Details
Closed on
Sep 23, 2003
Sold by
Dunn James J
Bought by
Dunn Jennifer C
Home Financials for this Owner
Home Financials are based on the most recent Mortgage that was taken out on this home.
Original Mortgage
$176,000
Interest Rate
6.31%
Mortgage Type
Purchase Money Mortgage
Purchase Details
Closed on
Jun 25, 1999
Sold by
Mahoney John P and Mahoney Barbara A
Bought by
Dunn James J and Dunn Jennifer C
Create a Home Valuation Report for This Property
The Home Valuation Report is an in-depth analysis detailing your home's value as well as a comparison with similar homes in the area
Home Values in the Area
Average Home Value in this Area
Purchase History
| Date | Buyer | Sale Price | Title Company |
|---|---|---|---|
| Prystowski Erin E | $277,000 | -- | |
| Dunn Jennifer C | -- | -- | |
| Dunn James J | $162,400 | -- |
Source: Public Records
Mortgage History
| Date | Status | Borrower | Loan Amount |
|---|---|---|---|
| Open | Dunn James J | $233,750 | |
| Closed | Prystowski Erin E | $238,350 | |
| Previous Owner | Dunn Jennifer C | $176,000 | |
| Previous Owner | Dunn James J | $162,000 |
Source: Public Records
Tax History Compared to Growth
Tax History
| Year | Tax Paid | Tax Assessment Tax Assessment Total Assessment is a certain percentage of the fair market value that is determined by local assessors to be the total taxable value of land and additions on the property. | Land | Improvement |
|---|---|---|---|---|
| 2025 | $5,620 | $370,200 | $129,500 | $240,700 |
| 2024 | $5,621 | $352,000 | $117,700 | $234,300 |
| 2023 | $5,087 | $299,600 | $112,000 | $187,600 |
| 2022 | $4,924 | $266,300 | $100,000 | $166,300 |
| 2021 | $4,773 | $252,800 | $94,200 | $158,600 |
| 2020 | $4,643 | $241,200 | $94,200 | $147,000 |
| 2019 | $2,932 | $231,000 | $89,800 | $141,200 |
| 2018 | $2,624 | $231,000 | $89,800 | $141,200 |
| 2017 | $2,640 | $226,600 | $91,200 | $135,400 |
| 2016 | $4,405 | $226,600 | $91,200 | $135,400 |
| 2015 | $4,186 | $225,800 | $91,200 | $134,600 |
| 2014 | $3,131 | $225,800 | $91,200 | $134,600 |
Source: Public Records
Map
Nearby Homes
- 1037 Shaker Rd
- 451 Falley Dr
- 929 Shaker Rd Unit 18
- 360 Falley Dr
- 20 Raymond Cir
- 22 Rosewood Ln
- 42 Rosewood Ln
- 44 Governor Dr
- 76 Rosewood Ln
- 69 Beveridge Blvd
- 57 Falley Dr
- 7 Sawgrass Ln
- 74 S Maple St
- 94 Pineridge Dr
- 82 S Maple St Unit 43
- 82 S Maple St Unit 11
- 70 S Maple St
- 70-74 S Maple St
- 112 Sunnyside Rd
- 60 Shaker Rd
- 56 Old Farm Rd
- 48 Old Farm Rd
- 53 Old Farm Rd
- 60 Old Farm Rd
- 34 Country Club Dr
- 44 Old Farm Rd
- 38 Country Club Dr
- 49 Old Farm Rd
- 30 Country Club Dr
- 61 Old Farm Rd
- 57 Old Farm Rd
- 42 Country Club Dr
- 45 Old Farm Rd
- 64 Old Farm Rd
- 40 Old Farm Rd
- 65 Old Farm Rd
- 46 Country Club Dr
- 26 Country Club Dr
- 41 Old Farm Rd
- 39 Country Club Dr