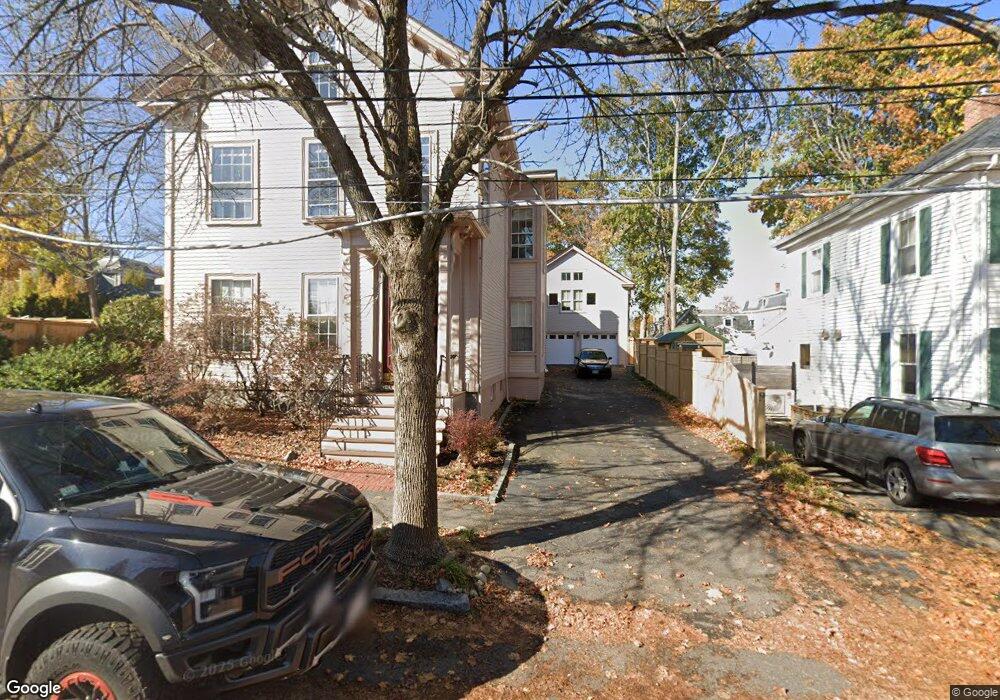
52 Olive St Unit 1 Newburyport, MA 01950
Estimated Value: $821,000 - $948,419
2
Beds
1
Bath
1,808
Sq Ft
$484/Sq Ft
Est. Value
About This Home
This home is located at 52 Olive St Unit 1, Newburyport, MA 01950 and is currently estimated at $874,355, approximately $483 per square foot. 52 Olive St Unit 1 is a home located in Essex County with nearby schools including Francis T. Bresnahan Elementary School, Edward G. Molin Elementary School, and Rupert A. Nock Middle School.
Ownership History
Date
Name
Owned For
Owner Type
Purchase Details
Closed on
Jun 15, 2000
Sold by
Lopreste Michael P and Lopreste Pamela A
Bought by
Carlson Albert G and Carlson Linda C
Current Estimated Value
Home Financials for this Owner
Home Financials are based on the most recent Mortgage that was taken out on this home.
Original Mortgage
$160,000
Interest Rate
8.24%
Mortgage Type
Purchase Money Mortgage
Purchase Details
Closed on
Oct 31, 1996
Sold by
Ricci Betty S
Bought by
Lopreste Michael P and Lopreste Pamela A
Home Financials for this Owner
Home Financials are based on the most recent Mortgage that was taken out on this home.
Original Mortgage
$175,000
Interest Rate
8.07%
Mortgage Type
Purchase Money Mortgage
Create a Home Valuation Report for This Property
The Home Valuation Report is an in-depth analysis detailing your home's value as well as a comparison with similar homes in the area
Home Values in the Area
Average Home Value in this Area
Purchase History
| Date | Buyer | Sale Price | Title Company |
|---|---|---|---|
| Carlson Albert G | $313,900 | -- | |
| Lopreste Michael P | $187,500 | -- |
Source: Public Records
Mortgage History
| Date | Status | Borrower | Loan Amount |
|---|---|---|---|
| Open | Lopreste Michael P | $157,000 | |
| Closed | Lopreste Michael P | $160,000 | |
| Closed | Lopreste Michael P | $160,000 | |
| Previous Owner | Lopreste Michael P | $175,000 |
Source: Public Records
Tax History Compared to Growth
Tax History
| Year | Tax Paid | Tax Assessment Tax Assessment Total Assessment is a certain percentage of the fair market value that is determined by local assessors to be the total taxable value of land and additions on the property. | Land | Improvement |
|---|---|---|---|---|
| 2025 | $8,045 | $839,800 | $0 | $839,800 |
| 2024 | $7,860 | $788,400 | $0 | $788,400 |
| 2023 | $7,976 | $730,000 | $0 | $730,000 |
| 2022 | $7,674 | $639,000 | $0 | $639,000 |
| 2021 | $7,607 | $601,800 | $0 | $601,800 |
| 2020 | $7,577 | $590,100 | $0 | $590,100 |
| 2019 | $7,321 | $559,700 | $0 | $559,700 |
| 2018 | $7,205 | $543,400 | $0 | $543,400 |
| 2017 | $6,994 | $520,000 | $0 | $520,000 |
| 2016 | $6,549 | $489,100 | $0 | $489,100 |
| 2015 | $6,243 | $468,000 | $0 | $468,000 |
Source: Public Records
Map
Nearby Homes
- 45 Boardman St Unit 1
- 41 Washington St Unit B
- 44 Washington St Unit C
- 14 Dexter Ln Unit B
- 14 Dexter Ln Unit A
- 158 Merrimac St Unit 3
- 27 Warren St Unit 1
- 2 Court St Unit 4
- 13 Broad St
- 126 Merrimac St Unit 35
- 58 Merrimac St Unit 2-5
- 1 Hill St
- 1 Hill St Unit 1
- 266 Merrimac St Unit F
- 288 Merrimac St
- 10 10th St
- 105 State St Unit 301
- 105 State St Unit 101
- 105 State St Unit 201
- 95 High St Unit 4
- 52 Olive St Unit 2
- 50 Olive St
- 48 Olive St Unit 2
- 48 Olive St Unit 1
- 57 Washington St
- 17 Buck St
- 46 Olive St Unit 2
- 46 Olive St
- 46 1/2 Olive St
- 19 Buck St
- 210 High St
- 55 Washington St
- 59 Washington St
- 42 Olive St
- 44 Olive St
- 44 Olive St Unit 44
- 44 Olive St Unit 2
- 44 Olive St Unit 1
- 53 Olive St
- 51 Olive St