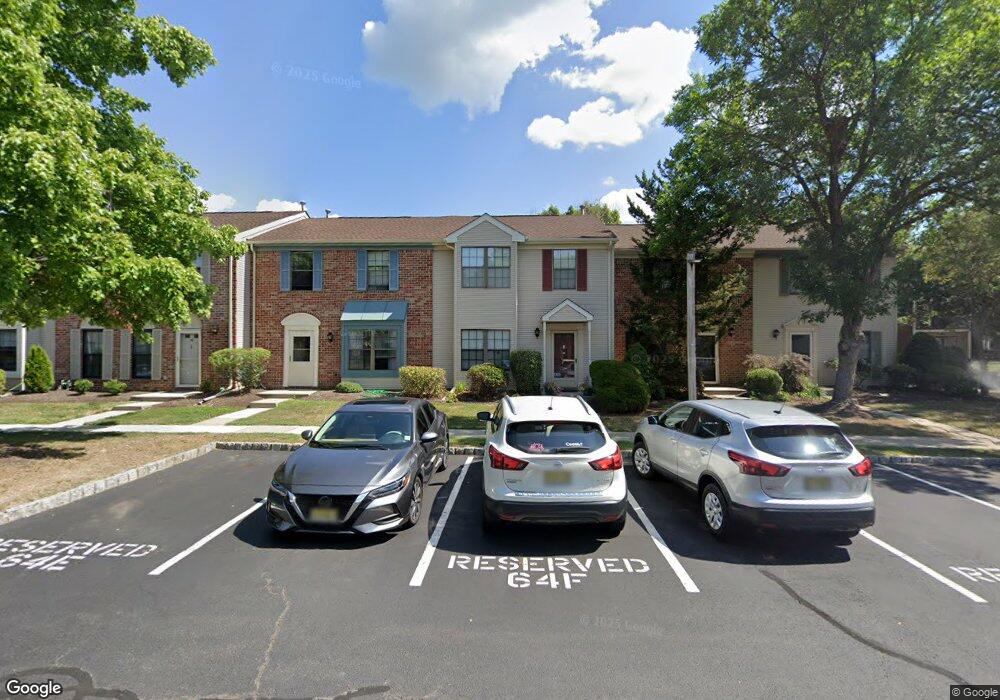
52 Oneill Ct Lawrence Township, NJ 08648
Estimated Value: $324,000 - $427,000
--
Bed
--
Bath
1,700
Sq Ft
$227/Sq Ft
Est. Value
About This Home
This home is located at 52 Oneill Ct, Lawrence Township, NJ 08648 and is currently estimated at $386,006, approximately $227 per square foot. 52 Oneill Ct is a home located in Mercer County with nearby schools including Lawrence High School, Chapin School Princeton, and Faith Christian Academy.
Ownership History
Date
Name
Owned For
Owner Type
Purchase Details
Closed on
Jul 13, 2018
Sold by
Smith Daniel T and Smith Deborah E
Bought by
Lyon Lynne
Current Estimated Value
Home Financials for this Owner
Home Financials are based on the most recent Mortgage that was taken out on this home.
Original Mortgage
$204,250
Outstanding Balance
$177,404
Interest Rate
4.6%
Mortgage Type
New Conventional
Estimated Equity
$208,602
Purchase Details
Closed on
Jul 30, 2004
Create a Home Valuation Report for This Property
The Home Valuation Report is an in-depth analysis detailing your home's value as well as a comparison with similar homes in the area
Home Values in the Area
Average Home Value in this Area
Purchase History
| Date | Buyer | Sale Price | Title Company |
|---|---|---|---|
| Lyon Lynne | $215,000 | National Integrity Llc | |
| -- | -- | -- |
Source: Public Records
Mortgage History
| Date | Status | Borrower | Loan Amount |
|---|---|---|---|
| Open | Lyon Lynne | $204,250 |
Source: Public Records
Tax History Compared to Growth
Tax History
| Year | Tax Paid | Tax Assessment Tax Assessment Total Assessment is a certain percentage of the fair market value that is determined by local assessors to be the total taxable value of land and additions on the property. | Land | Improvement |
|---|---|---|---|---|
| 2025 | $6,196 | $200,000 | $50,000 | $150,000 |
| 2024 | $6,072 | $200,000 | $50,000 | $150,000 |
| 2023 | $6,072 | $200,000 | $50,000 | $150,000 |
| 2022 | $5,962 | $200,000 | $50,000 | $150,000 |
| 2021 | $5,886 | $200,000 | $50,000 | $150,000 |
| 2020 | $5,804 | $200,000 | $50,000 | $150,000 |
| 2019 | $5,730 | $200,000 | $50,000 | $150,000 |
| 2018 | $5,600 | $200,000 | $50,000 | $150,000 |
| 2017 | $5,574 | $200,000 | $50,000 | $150,000 |
| 2016 | $5,492 | $200,000 | $50,000 | $150,000 |
| 2015 | $5,340 | $200,000 | $50,000 | $150,000 |
| 2014 | $5,240 | $200,000 | $50,000 | $150,000 |
Source: Public Records
Map
Nearby Homes