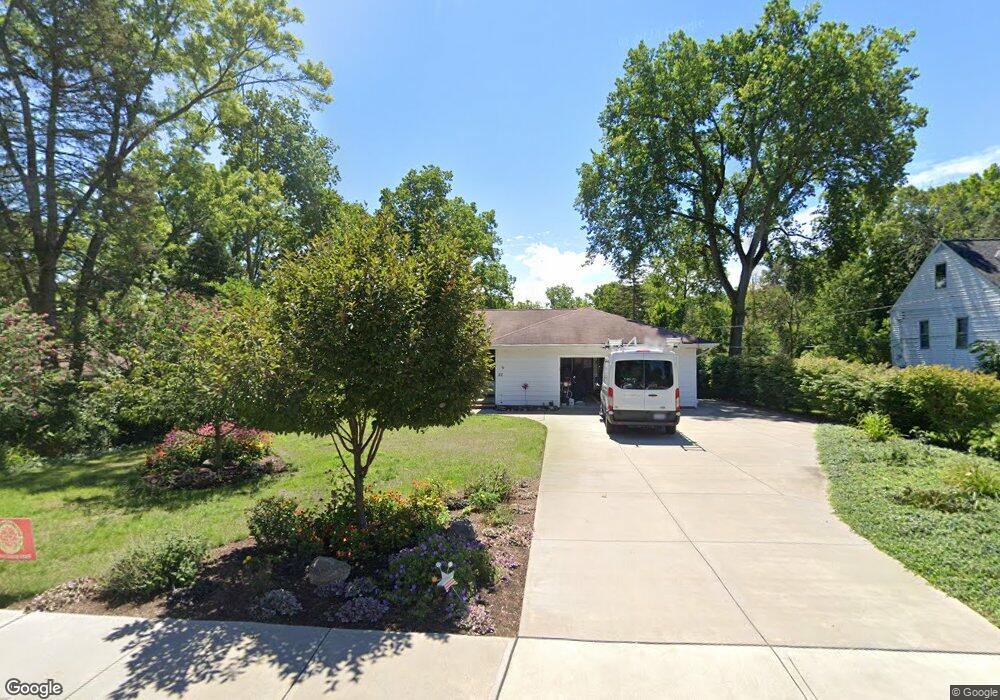
52 Overlook Place Bedford, OH 44146
Estimated Value: $194,000 - $235,000
3
Beds
2
Baths
1,286
Sq Ft
$161/Sq Ft
Est. Value
About This Home
This home is located at 52 Overlook Place, Bedford, OH 44146 and is currently estimated at $206,506, approximately $160 per square foot. 52 Overlook Place is a home located in Cuyahoga County with nearby schools including Heskett Middle School, Bedford High School, and Ohio College Preparatory School.
Ownership History
Date
Name
Owned For
Owner Type
Purchase Details
Closed on
Apr 4, 2008
Sold by
Karius Diana L
Bought by
Wimer Dwayne E
Current Estimated Value
Home Financials for this Owner
Home Financials are based on the most recent Mortgage that was taken out on this home.
Original Mortgage
$82,400
Outstanding Balance
$53,142
Interest Rate
6.32%
Mortgage Type
Purchase Money Mortgage
Estimated Equity
$153,364
Purchase Details
Closed on
Jul 12, 2004
Sold by
Hitzler Wallace and Wimer Anna G
Bought by
Wimer Anna G and Hitzler Anna G
Purchase Details
Closed on
Jan 29, 1993
Sold by
Wimer Anna G
Bought by
The Trust Of Anna G.
Purchase Details
Closed on
Dec 15, 1986
Sold by
Macura George
Bought by
Wimer Anna G
Purchase Details
Closed on
May 6, 1983
Sold by
Davis Anne L
Bought by
Macura George
Purchase Details
Closed on
Apr 19, 1977
Sold by
Davis Edw and Davis Anne L
Bought by
Davis Anne L
Purchase Details
Closed on
Jan 1, 1975
Bought by
Davis Edw and Davis Anne L
Create a Home Valuation Report for This Property
The Home Valuation Report is an in-depth analysis detailing your home's value as well as a comparison with similar homes in the area
Home Values in the Area
Average Home Value in this Area
Purchase History
| Date | Buyer | Sale Price | Title Company |
|---|---|---|---|
| Wimer Dwayne E | -- | Real Living Title Agency Ltd | |
| Wimer Anna G | -- | -- | |
| The Trust Of Anna G. | -- | -- | |
| Wimer Anna G | $81,500 | -- | |
| Macura George | -- | -- | |
| Davis Anne L | -- | -- | |
| Davis Edw | -- | -- |
Source: Public Records
Mortgage History
| Date | Status | Borrower | Loan Amount |
|---|---|---|---|
| Open | Wimer Dwayne E | $82,400 |
Source: Public Records
Tax History Compared to Growth
Tax History
| Year | Tax Paid | Tax Assessment Tax Assessment Total Assessment is a certain percentage of the fair market value that is determined by local assessors to be the total taxable value of land and additions on the property. | Land | Improvement |
|---|---|---|---|---|
| 2024 | $4,468 | $58,695 | $12,075 | $46,620 |
| 2023 | $4,175 | $47,330 | $11,730 | $35,600 |
| 2022 | $3,684 | $47,320 | $11,730 | $35,600 |
| 2021 | $3,585 | $47,320 | $11,730 | $35,600 |
| 2020 | $2,971 | $34,790 | $8,610 | $26,180 |
| 2019 | $2,894 | $99,400 | $24,600 | $74,800 |
| 2018 | $2,809 | $34,790 | $8,610 | $26,180 |
| 2017 | $2,773 | $31,610 | $8,580 | $23,030 |
| 2016 | $2,749 | $31,610 | $8,580 | $23,030 |
| 2015 | $5,861 | $31,610 | $8,580 | $23,030 |
| 2014 | $5,861 | $34,370 | $9,310 | $25,060 |
Source: Public Records
Map
Nearby Homes
- 3011 Bluestone Ln
- 886 Archer Rd
- 5832 Bear Creek Dr Unit 5832
- 471 Columbus St
- 733 High St
- 24051 Columbus Rd
- 5696 Columbia Dr
- 809 Wellmon St
- 763 High St
- 639 Lincoln Blvd
- 24634 Staghorn Dr
- 24720 Randolph Rd
- 109 Avalon Dr
- 6254 Randolph Rd
- 24645 Eldridge Blvd
- 197 Columbus St
- 52 Avalon Dr
- 5807 Kimberly Dr
- 179 Willard Ave
- 5876 Marra Dr
- 46 Overlook Place
- 60 Overlook Place
- 36 Overlook Place
- 72 Overlook Place
- 41 Overlook Place
- 787 Archer Rd
- 57 Overlook Place
- 51 Overlook Place
- 74 Overlook Place
- 30 Overlook Place
- 33 Overlook Place
- 67 Overlook Place
- 78 Overlook Place
- 775 Archer Rd
- 73 Overlook Place
- 27 Overlook Place
- 771 Archer Rd
- 789 Archer Rd
- 84 Overlook Place
- 767 Archer Rd