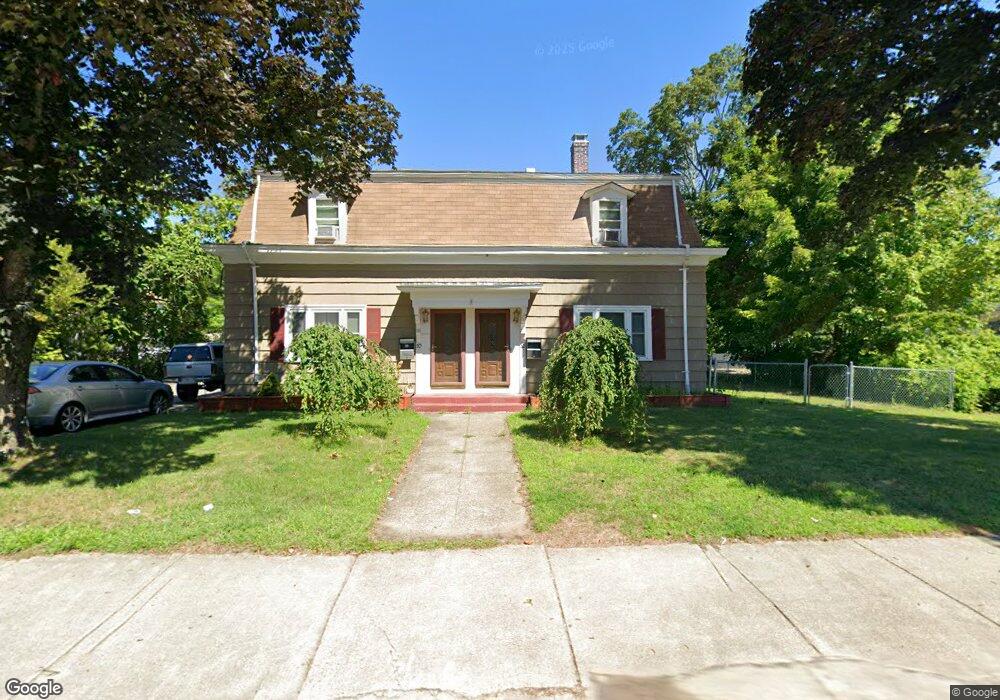
52 Peck St Unit 54A Attleboro, MA 02703
Estimated Value: $409,000 - $444,000
4
Beds
4
Baths
1,350
Sq Ft
$319/Sq Ft
Est. Value
About This Home
This home is located at 52 Peck St Unit 54A, Attleboro, MA 02703 and is currently estimated at $430,264, approximately $318 per square foot. 52 Peck St Unit 54A is a home located in Bristol County with nearby schools including Thomas E. Willett School, Cyril K. Brennan Middle School, and Attleboro High School.
Ownership History
Date
Name
Owned For
Owner Type
Purchase Details
Closed on
Apr 18, 2003
Sold by
Murray Paul A and Murray Monalisa
Bought by
Murray Paul A and Murray Monalisa
Current Estimated Value
Purchase Details
Closed on
Oct 1, 1996
Sold by
Nixon Jerry M and Nixon Carol A
Bought by
Murray Paul A and Murray Monalisa
Home Financials for this Owner
Home Financials are based on the most recent Mortgage that was taken out on this home.
Original Mortgage
$95,950
Interest Rate
7.83%
Mortgage Type
Purchase Money Mortgage
Create a Home Valuation Report for This Property
The Home Valuation Report is an in-depth analysis detailing your home's value as well as a comparison with similar homes in the area
Home Values in the Area
Average Home Value in this Area
Purchase History
| Date | Buyer | Sale Price | Title Company |
|---|---|---|---|
| Murray Paul A | -- | -- | |
| Murray Paul A | $97,000 | -- |
Source: Public Records
Mortgage History
| Date | Status | Borrower | Loan Amount |
|---|---|---|---|
| Previous Owner | Murray Paul A | $114,500 | |
| Previous Owner | Murray Paul A | $95,950 |
Source: Public Records
Tax History Compared to Growth
Tax History
| Year | Tax Paid | Tax Assessment Tax Assessment Total Assessment is a certain percentage of the fair market value that is determined by local assessors to be the total taxable value of land and additions on the property. | Land | Improvement |
|---|---|---|---|---|
| 2025 | $3,552 | $283,000 | $119,300 | $163,700 |
| 2024 | $3,694 | $290,200 | $119,300 | $170,900 |
| 2023 | $3,336 | $243,700 | $108,500 | $135,200 |
| 2022 | $3,391 | $234,700 | $103,300 | $131,400 |
| 2021 | $2,981 | $201,400 | $99,300 | $102,100 |
| 2020 | $2,887 | $198,300 | $96,400 | $101,900 |
| 2019 | $2,597 | $183,400 | $94,600 | $88,800 |
| 2018 | $1,454 | $175,000 | $91,800 | $83,200 |
| 2017 | $2,414 | $165,900 | $91,800 | $74,100 |
| 2016 | $2,302 | $155,300 | $85,900 | $69,400 |
| 2015 | $2,121 | $144,200 | $85,900 | $58,300 |
| 2014 | $2,268 | $152,700 | $81,400 | $71,300 |
Source: Public Records
Map
Nearby Homes