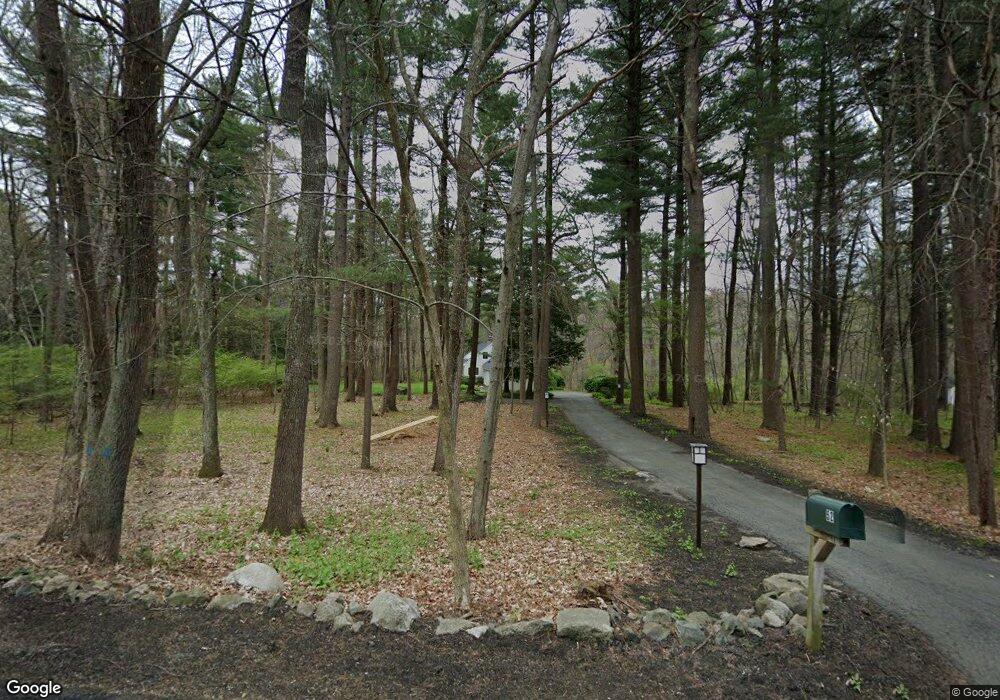
52 Pine St Weston, MA 02493
Estimated Value: $1,733,773 - $2,424,000
4
Beds
4
Baths
2,258
Sq Ft
$926/Sq Ft
Est. Value
About This Home
This home is located at 52 Pine St, Weston, MA 02493 and is currently estimated at $2,091,693, approximately $926 per square foot. 52 Pine St is a home located in Middlesex County with nearby schools including Country Elementary School, Woodland Elementary School, and Field Elementary School.
Ownership History
Date
Name
Owned For
Owner Type
Purchase Details
Closed on
Dec 16, 1992
Sold by
Holdsworth Brian and Holdsworth Patricia
Bought by
Hirsch Clifford J and Hirsch Marilyn Y
Current Estimated Value
Home Financials for this Owner
Home Financials are based on the most recent Mortgage that was taken out on this home.
Original Mortgage
$200,000
Interest Rate
8.3%
Mortgage Type
Purchase Money Mortgage
Create a Home Valuation Report for This Property
The Home Valuation Report is an in-depth analysis detailing your home's value as well as a comparison with similar homes in the area
Home Values in the Area
Average Home Value in this Area
Purchase History
| Date | Buyer | Sale Price | Title Company |
|---|---|---|---|
| Hirsch Clifford J | $437,500 | -- |
Source: Public Records
Mortgage History
| Date | Status | Borrower | Loan Amount |
|---|---|---|---|
| Closed | Hirsch Clifford J | $200,000 |
Source: Public Records
Tax History
| Year | Tax Paid | Tax Assessment Tax Assessment Total Assessment is a certain percentage of the fair market value that is determined by local assessors to be the total taxable value of land and additions on the property. | Land | Improvement |
|---|---|---|---|---|
| 2025 | $16,492 | $1,485,800 | $829,100 | $656,700 |
| 2024 | $16,078 | $1,445,900 | $829,100 | $616,800 |
| 2023 | $15,803 | $1,334,700 | $829,100 | $505,600 |
| 2022 | $15,701 | $1,225,700 | $791,300 | $434,400 |
| 2021 | $48 | $1,166,600 | $752,300 | $414,300 |
| 2020 | $14,654 | $1,142,200 | $752,300 | $389,900 |
| 2019 | $14,320 | $1,137,400 | $752,300 | $385,100 |
| 2018 | $82 | $1,137,400 | $752,300 | $385,100 |
| 2017 | $12,876 | $1,038,400 | $752,300 | $286,100 |
| 2016 | $12,627 | $1,038,400 | $752,300 | $286,100 |
| 2015 | $12,225 | $995,500 | $718,100 | $277,400 |
Source: Public Records
Map
Nearby Homes
- 286 Country Dr
- 83 Brown St
- 253 Highland St
- 4 Essex
- 231 Westerly Rd
- 01 Wellesley St
- 0 Wellesley St
- 16 Coltsway Unit 16CW
- 12 Cutting Cross Way
- 10 Audubon Rd
- 63 Sylvan Ln
- 1203 Magnolia Dr Unit 1203
- 556 Wellesley St
- 180 Highland St
- 205 Hayfield Ln Unit 205
- 568 Wellesley St
- 9 Sanderson Ln
- 21 Westerly Rd
- 23 Covered Bridge Ln
- 169 Hickory Rd
Your Personal Tour Guide
Ask me questions while you tour the home.